


Incidence: Risk, Cumulative Incidence (Incidence Proportion), and Incidence Rate
In contrast to prevalence , incidence is a measure of the occurrence of new cases of disease (or some other outcome) during a span of time. There are two related measures that are used in this regard: incidence proportion (cumulative incidence) and incidence rate. A useful way to think about cumulative incidence (incidence proportion) is that it is the probability of developing disease over a stated period of time; as such, it is an estimate of risk. Ken Rothman uses the example of a newspaper article that states that women who are 60 years of age have a 2% risk of dying from cardiovascular disease. As written this statement is impossible to interpret, because it doesn't specify a time period. In order to interpret risk it is necessary to know the length of time that applies. A 2% risk has a very different meaning if it is over the next 12 months vs. the next 10 years. Therefore, the incidence proportion (cumulative incidence) must specify a time period. For example, the incidence proportion of neonatal mortality is the number of deaths divided by the number of births over the first 30 days after birth.
The concept of risk is fairly intuitive - if a group of disease-free people were followed for a period of time, one could determine the proportion of people who developed the disease at some point during the observation period in order to arrive at an estimate of the probability of developing that disease, i.e. the risk. However appealing this is for its simplicity, there are some drawbacks to this approach to assessing the occurrence of health outcomes, because an accurate assessment of probability relies on observing all subjects for the entire observation period. This is particularly a problem when assessing long term risk.
- First, there are competing risks that might result in the death of some subjects before the observation period ends, making it impossible to know whether they would have developed the outcome of interest if they had not died early because of another risk. For example, studying the incidence proportion of long term health conditions among soldiers in a conflict zone is complicated by the elevated risk of dying in combat before the outcome can be observed.
- A second problem is that, even if subjects don't die for another reason, it is difficult to follow people for long periods of time, and subjects can become lost to follow-up , which also means that their outcome status is unknown.
- A third problem is that the incidence proportion doesn't distinguish when a disease occurs as long as it is within the follow-up period. For example, if a population is followed for 20 years, it would make a difference to the person and to the epidemiologist if the cancer occurred after two years or after 20 years, but both of these outcomes would count the same with the incidence proportion.
For this reason, the incidence proportion is generally used in situations where the follow-up time is relatively short and there is relatively little loss to follow-up. Otherwise, epidemiologists generally use the incidence rate.
Ideally, if we are to estimate incidence (incidence proportion or incidence rate), we would want to measure this in a sample of people who are truly at risk of developing the outcome of interest. So, in measuring incidence we would like to exclude anyone who was not at risk of developing disease, because they already had the disease or because they couldn't develop it. For example, if one wanted to estimate the risk of developing uterine cancer in postmenopausal women, we ideally would like to exclude women who had previously undergone hysterectomy (removal of the uterus), since they are no longer at risk of developing this particular type of cancer.
Diabetes in a Nursing Home
 Suppose we were interested in the problem of diabetes in a nursing home with 800 residents. We would begin by doing blood tests on all residents to determine which were diabetic. If 50 of the residents were diabetic initially, then the prevalence of diabetes at this point in time would be 50/800 = 0.0625. The standard way of expressing this would be to say that the prevalence was 62.5 per 1000 residents or 6.25 per 100 residents, or 0.0625%
If we want to estimate the incidence of diabetes in this population over the next 12 months, we need to exclude the 50 people who are already diabetic and focus on the 750 residents who are disease-free initially. We would then need to do additional blood tests to determine how many new cases developed during the span of time. Because some of the residents might die or be transferred to other facilities during the year, we ideally would like to take blood tests frequently, but for financial and logistical reasons, we might simply conduct a second series of blood tests after one year. If 25 were found to be diabetic at the end of a year, then the incidence would be 25/750 = 0.0333 or about 3.3 per hundred (3.3%) over a year. Note that we are describing the time span, i.e. the period of observation, when we report the incidence.
When incidence is determined in this way, that is, by evaluating the presence of disease at the beginning and then dividing the number of known new cases by the number of people "at risk" at the beginning, it is referred to as a cumulative incidence and can also be thought of as the incidence proportion. While people commonly refer to this as a 'rate,' this is really a proportion. It is the proportion of the "at risk" group that developed disease over a stated block of time.
The cumulative incidence of AIDS in MA during 2004:
Cumulative incidence is easy to measure and is commonly used in a wide variety of circumstances. For example, if we wanted to determine the incidence of AIDS in Massachusetts during calendar year 2004, it isn't feasible for us to check every citizen at the beginning and end of the year. Census data gives us a rough idea of how many people lived in Massachusetts during 2004, and AIDS is a reportable disease, so we could go to the MA Department of Public Health and obtain an estimate of the number of people with AIDS at the beginning of the year, and we could subtract this number from the population size to get a denominator that represents the number of people "at risk" of developing AIDS. Then, we could go back to DPH at the end of the calendar year and ask how many new people had been reported with AIDS. This is our numerator. So, the cumulative incidence would be:
(# new AIDS cases reported during the year) / (population of MA at risk),
i.e. minus existing cases at the beginning of the year)
In reality, there were 523 new AIDS cases reported in MA in 2004, and the population was about 5.7 million. So, the cumulative incidence was about 9.2 per 100,000 people during 2004. Note that the denominator is just an estimate based on the last census. In reality, people were being added to and subtracted from the population continually as a result of births, deaths, moving into the city, and moving out. We also didn't take into account exactly when they developed AIDS, although we probably don't care whether they developed it earlier or later within a one year period. Nevertheless, this cumulative incidence is a useful number, and it is relatively easy to get the information we need to calculate it.
It is important to specify the time period when reporting cumulative incidence. In the fall semester of 2003 there were 130 students in EP713 at the beginning of the semester, and 55 of them reported developing a cold or other respiratory infection during the semester. So, the cumulative incidence = 55/130 = 0.42307 or 42.3% over the course of the semester. The time period of observation is expressed in words.
Incidence Rate
Remember that a rate almost always contains a dimension of time. Therefore, the incidence rate is a measure of the number of new cases ("incidence") per unit of time ("rate"). Compare this to the cumulative incidence (incidence proportion), which measures the number of new cases per person in the population over a defined period of time. Because studies of incidence in epidemiology are conducted among groups of people as they move through time, the denominator is actually a combination of the number of people and the amount of time. This is expressed as person-time. The time units can be expressed in days, months, or years, but should be tied to the length of the study and aid interpretation of the results. The most frequently encountered expression is "person-years". The characteristics of cumulative incidence and incidence rate are illustrated in the examples below.
Note: While we generally refer to cumulative incidence (incidence proportion) and incidence rate as measures of disease frequency, they can be applied to any sort of occurrence. For example, treatments to cure or relieve disease conditions are also measured using the incidence proportion or rate, as we will see in the example below. The key thing to keep in mind is that either measure of incidence (unlike prevalence) measures a transition from one state to another: well to sick, sick to well, alive to dead, unborn to born, etc.
A comparison of pain relief with two analgesics:
Suppose you were asked to analyze the data from a small preliminary clinical trial with 20 subjects. All subjects had a comparable degree of knee pain from osteoarthritis, and they were being compared with respect to pain relief after receiving a standard pain medication (Drug B) or a new pain medication (Drug A). The 20 patients were randomly assigned to one drug or the other, and there were ten subjects in each group. After receiving the medication, the investigators checked on the subjects at hourly intervals to see if the subjects had had relief of pain. For each subject, the time at which pain relief occurred was recorded. Results are illustrated in the graph below. Link to a text description of the results
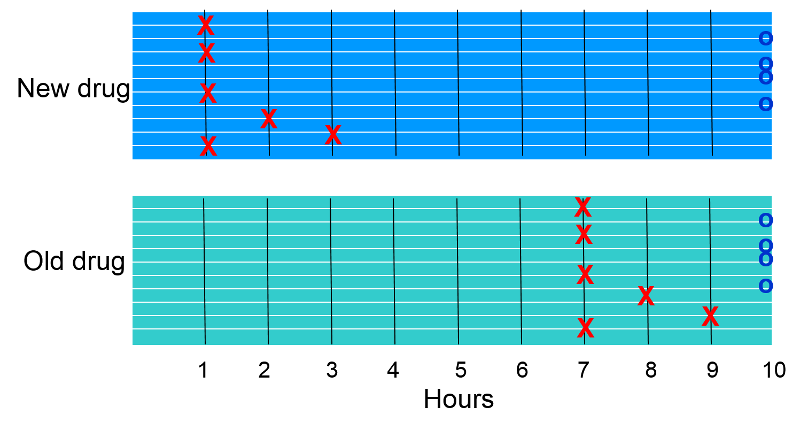
The "X"s indicate when subjects reported pain relief. The "O"s at the end indicate subjects who did not report relief of pain.
- Which group appears to have had a greater incidence rate of pain relief?
- How did the cumulative incidence of pain relief compare (the proportion of subjects experiencing pain relief)?
Cumulative Incidence
Six of ten subjects in each group experienced relief of pain, so the cumulative incidence of pain relief was 6/10 = 60% in each group. Whenever cumulative incidence is determined, one determines the proportion of subjects who experienced the outcome of interest during a block of time, without taking into account when subjects developed the outcome. Visually, however, it is clear that if we consider when subjects experienced relief, the rate was greater in the subjects receiving the new drug.
Incidence Rate
In this hypothetical study all subjects were observed for a maximum of 10 hours, and some did not achieve pain relief, while others got relief after varying periods of time. We can calculate the average rate of pain relief in each group by adding up the duration of pain for subjects in each group and dividing by the number of subjects in each group.
In the group receiving the new drug the times were 4x1 + 2 + 3+ 4x10= 49 hours for the group (person-hours). So the incidence rate of relief was 6/49 person-hours or on average 12.2 per 100 person-hours of observation. Note that once a subject experiences the outcome of pain relief, they are no longer considered to be under observation.
In the group receiving the old drug the times were 4x7 + 8 + 9 + 4x10= 85 hours for the group (person-hours). So the incidence rate of relief was 6/85 person-hours or on average 7.0 per 100 person-hours of observation. So, the rate of pain relief was greater in the group receiving the new drug.
What we have calculated is the incidence rate. This is a true rate, because time is an integral part of the calculation, analogous to miles per hour (a rate of speed) or gallons per minute (a rate of flow).
Several things are noteworthy about this incidence rate.
- The numerator is the same for both cumulative incidence and incidence rate; it is the number of individuals who developed the outcome of interest (in this case pain relief) during the observation period.
- The denominators for cumulative incidence and incidence rate are very different. For cumulative incidence, the denominator is the total number of "at risk" subjects being followed; for incidence rate, the denominator is the total amount of time "at risk" of continued pain for all the subjects who were being followed. Therefore, we can only calculate an incidence rate if we have periodic follow-up information on each subject, including not only if they developed the outcome, but also when they developed it.
- The incidence rate is a more accurate estimate of the rate at which the outcome develops. Cumulative incidence is frequently referred to as a 'rate', but it really is the proportion of people who develop the outcome during a fixed block of time. This was useful when we wanted to describe the incidence of AIDS in Massachusetts, because we didn't have detailed information on each and every resident of the state. We couldn't take into account when people developed AIDS. Moreover, we couldn't account for people who moved into the state in the middle of the year or people who moved out or died. With incidence rate, however, we can take these factors into account. The strategy is the same as in the pain relief sample above, i.e. the denominator takes into account the total amount of "at risk" time for the group.
- Incidence rates are particularly advantageous when trying measure incidence in studies with dynamic populations and in studies with fixed populations with relatively long follow-up time.

Question: A participant in a prospective cohort study or a randomized clinical trial stops contributing additional "disease-free observation time" when they develop the outcome of interest or become lost to follow-up for any reason (death, failure to respond to phone calls, letters and emails, etc.). Does this mean that they are no longer in the study?
Incidence of HIV in a Brothel
A follow-up study was conducted to determine which sexual behaviors were associated with the greatest risk of becoming HIV+. The study was conducted in a group of female prostitutes. The subjects were tested prior to the beginning of the study, and five HIV+ women were excluded. The the remaining ten women were followed for six years beginning in January 1989. Each woman was contacted and retested at the beginning of January each year. The table below summarizes the findings these ten subjects. A circled plus sign (+) indicates when a subject was found to be HIV+; a question mark (?) indicates when a subject became lost to follow-up. The dashed lines indicate continued follow-up.
Link to a detailed description of the table below
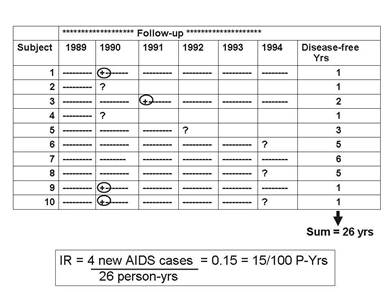
The cumulative incidence was 4/10=40% over six years, but this doesn't take into account the different amounts of time contributed by those who didn't become HIV positive, one of whom (Subject #7) was followed throughout the six years of the study, but the remainder of whom were lost to follow-up sometime before the end of the study (Subjects #2, 4, 5, 6, 8).
The incidence rate, however, can take these problems into account, because the denominator is the total "at risk" observation time contributed by all ten subjects. The column at the far right indicates each subject's "at risk" observation time, and the sum for the ten subjects was 26 years. So, the IR= 4/26 person-yrs = 0.15/person-year = 15/100 person-years of observation.
Note that person-time stopped being counted as soon as the subject was found to be HIV positive, because the subject was no longer "at risk" of developing the outcome—they already had experienced it. For example, Subject #1 contributed one person-year even though she was followed for all six years.
Incidence rates are often computed in prospective cohort studies (e.g., The Framingham Heart Study or The Nurses Health Study) and randomized clinical trials (e.g., The Physician's Health Study, which looked at the effect of low-dose aspirin on heart disease). It is more accurate than cumulative incidence, but it requires repeated follow-up observations on each subject, and studies like this can be very expensive and time consuming.
Also consider that subjects are sometimes recruited into studies at different times. Each subject's disease-free observation time or "at risk" time can be calculated as the time from their entry into the study until a) they get the disease, b) they become lost to follow-up, or c) the study ends.
For example, consider a hypothetical clinical trial that was conducted to determine whether taking low-dose aspirin reduced the frequency of heart attacks in middle-aged and elderly men. The time line below summarizes events 12 subjects labeled 1-12, all of whom were allocated to the placebo-treated group.
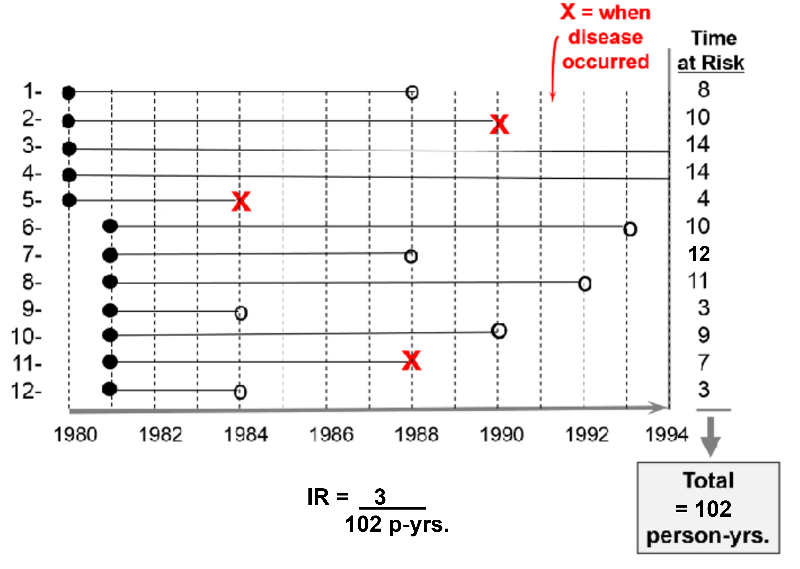
The first 5 subjects were enrolled in 1980, and the next 7 subjects were enrolled one year later. All subjects began taking aspirin upon enrollment. Therefore their "exposure" to aspirin began upon enrollment as indicated by the solid black dots.
The red "X"s indicate when subjects had a heart attack; their exposure time at risk ends there, since having a first heart attack means that they were no longer at risk of having a first heart attack; they had the outcome of interest at that point. Subject #2 had a heart attack in 1990; subject #5 had one in 1984; subject #11 had one in 1988.
The open circles indicated six subjects who were lost to follow-up. They stopped responding to all requests for follow up after that point. We know that they had not had a heart attack up to that point, but we don't know what happened to them after that, so they stop contributed observed exposure time at risk. Subject #1 was lost to follow up in 1988; #6 was lost in 1993; #7 was lost in 1988; #8 was lost in 1992; #9 was lost in 1984;
All of this information can be taken into account in order to compute the average rate at which heart attacks occur in this group of 12 men being treated with low-dose aspirin. We can do this in a way that is analogous to example #2 above. There were 3 heart attacks, and we divide this by the total amount of time that the men were exposed and at risk of developing a heart attack. For each man the exposure time at risk is the time from their entry into the study until one of three endpoints: a) the disease occurs, b) the subject is lost to follow-up, or c) the study concludes. The exposure time at risk for each man is shown in the column at the far right of the figure, and if we add these, the total exposure time for the group was 102 years. Therefore, the average rate at which the outcome occurred was 3/ 102 person-years of observed exposure time.
Example: Incidence Rate in the Nurse's Health Study - Estrogens and Coronary Artery Disease
Data collected from the Nurses' Health Study, a prospective cohort study, was used to compare rates of coronary artery disease in post-menopausal women using hormone replacement therapy (HRT) and post-menopausal women who had not used HRT. The data was summarized in the table below.
|
|
Coronary Artery Disease |
Person-Years of Disease Free Observation |
|---|---|---|
|
Used HRT |
30 |
54,308.7 |
|
No Use of HRT |
60 |
51,477.5 |
Women on postmenopausal hormones had an incidence rate of 30 events during 54,308.7 person years of follow-up, or 55.2 / 100,000 person-years. Women in the untreated group had 60 events during 51,477.5 person-years of follow-up - an incidence rate of 116.6 / 100,000 person-years.
Another Example: Incidence Rate in the Nurse's Health Study – Obesity and Myocardial Infarction
In this study, incidence rates of MI (myocardial infarction) were compared among five groups of women based on their body mass index (BMI). There were certainly different numbers of women in the five groups, but for each group they computed the incidence rate by counting the number who developed MI and dividing by the group's total "at risk" time of observation. The result was then converted to the number per 100,000 person-years to facilitate comparison among the five groups.
|
Body Mass Index (BMI) |
# Non-fatal Myocardial Infarctions |
Person-Years of Observation |
Incidence Rate per 100,000 Person-Years |
|---|---|---|---|
|
<21 |
41 |
177,356 |
23.1 |
|
21.0-22.9 |
57 |
194,243 |
29.3 |
|
23.0-24.9 |
58 |
155,717 |
36.0 |
|
25.0-29.9 |
67 |
148,541 |
45.1 |
|
>30 |
85 |
99,573 |
85.4 |
Units for Denominators
By convention, all three measures of disease frequency (prevalence, cumulative incidence, and incidence rate) are expressed as some multiple of 10 in order to facilitate comparisons. Consider these three examples:
- Cumulative incidence: 4/10 over 6 years = 0.40 = 40 per 100 or 40% over 6 years
- Incidence rate: 3/107.7 person-yrs = 0.02785/person-year = 28 per 1,000 person-years
One can express the final result as the number of cases per 100 people, or per 1,000 people, or per 10,000 people, or per 100,000. Generally one uses a convenient multiple of ten. For example, the expressions below are all equivalent, but the last two are the most convenient to talk about & think about. Note: Each time you move the decimal to the right, you increase the number by a factor of 10.
|
Equivalent Expressions of Disease Frequency 0.00232 new cases per 1 person-yrs. 0.0232 new cases per 10 person-yrs. 0.232 new cases per 100 person-yrs. 2.32 new cases per 1,000 person-yrs. 23.2 new cases per 10,000 person-yrs. 232 new cases per 100,000 person-yrs.
|

 Common Pitfall: A common mistake among beginning students is to fail to specify the dimensions after calculating incidence, especially for cumulative incidence.
- In the example for HIV in sex workers, the incidence rate should be reported as 15 per 100 person-years. Note that this number is not the equivalent of a percentage.
- In the same example, the cumulative incidence was 4 per 10 subjects (40%) over 6 years. Note: You must specify the time period for cumulative incidence or you will lose points on the exams.
|
Prevalence (a proportion) = People # People with disease at a point in time Total People # People in the study population
Cumulative Incidence (a proportion) = People # new cases in a specified period Total People # People (at risk) in the study population
Incidence Rate (a rate) = People # new cases of disease People-Time Total observation time in a group at risk |