

Programming a Two-Sample t-test in SAS
proc ttest data=name;
class group; /* defines the grouping variable */
var var; /* variable whose means will be compared */
run;
Example
/* Perform the t-test */
title 'Two Sample T-Test';
proc ttest data=work.dix;
class cor; /* defines the grouping variable */
var age; /* variable whose means will be compared */
run;
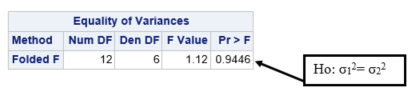
Step 1: Check equal variance assumption, : σ12 = σ22
The boxplots on the previous page seem to indicate that the variances in the two groups are reasonably similar. Further, the ratio of variances is 1.12 also indicating that the two groups have similar sample variances and thus we might assume that they have equal population variances.
To conduct the formal F test we compare the p-value for the F statistic from SAS to 0.05 (which is two-sided here). The p-value for the F test using SAS is not significant at α=0.05 (p = 0.9446), so we do not reject H0: σ12 = σ22
Since we do not reject the null hypothesis of equal population variances and the boxplots and ratio of variances seem to indicate similar sample variances, we will assume that the population variances are equal and thus use the pooled standard error.
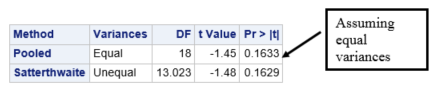
Step 2: Test the null hypothesis of equal means using the t-test assuming equal variances:
The t statistic is -1.45 with 18 degrees of freedom, with p = 0.1633. This p-value is greater than α=0.05, so we fail to reject H0: μ1 = μ2.
Step 3: Estimation:
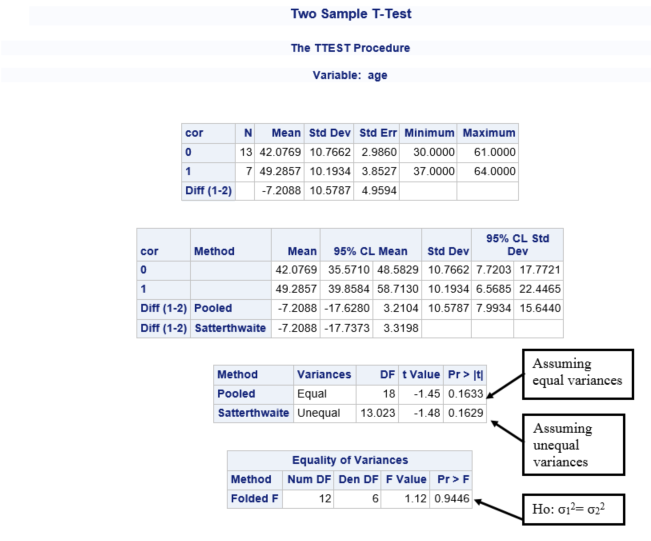
PROC TTEST automatically outputs point and interval estimates of the means and standard deviations for each group and for the difference between groups.
The mean age of the group with coronary events was 49.29 (95% CI = 39.86, 58.71) compared to a mean age of 42.08 (95% CI = 35.57, 48.58) for the group without coronary events.
Reporting Results:
Null Hypothesis: The mean age of people with a coronary event between 1952 and 1962 is the same as the mean age of people without a coronary event between 1952 and 1962:
![]()
Alternative Hypothesis: The mean age of people with a coronary event between 1952 and 1962 is not the same as the mean age of people without a coronary event between 1952 and 1962:
![]()
Level of significance: α=0.05
Results: The mean age is 7.209 years lower in those without coronary events than among those who had coronary events. The 95% confidence interval for this difference is (-17.63, 3.21).
First we performed an F-test of equal variances. There is not significant evidence (F =1.12 , degrees of freedom =12,6 ,p=0.94) that the variances are different. We therefore used a t-test assuming equal variances to test whether the mean age of people with a coronary event was different from the mean age of people without a coronary event between 1952 and 1962. The t-statistic is -1.45 with 18 degrees of freedom, and p = 0.1633. This p-value is greater than α=0.05, so we fail to reject the null hypothesis that the means are equal.
Conclusion: There is not significant evidence (p = 0.1633) that the mean age of those who had coronary events by 1962 (49.286) is different than the mean age of those who did not have coronary events by 1962 (42.077).