


Simple Linear Regression
Introduction
Regression analysis is commonly used for modeling the relationship between a single dependent variable Y and one or more predictors. When we have one predictor, we call this "simple" linear regression:
E[Y] = β0 + β1X
That is, the expected value of Y is a straight-line function of X. The betas are selected by choosing the line that minimizing the squared distance between each Y value and the line of best fit. The betas are chose such that they minimize this expression:
∑i (yi – (β0 + β1X))2
An instructive graphic I found on the Internet
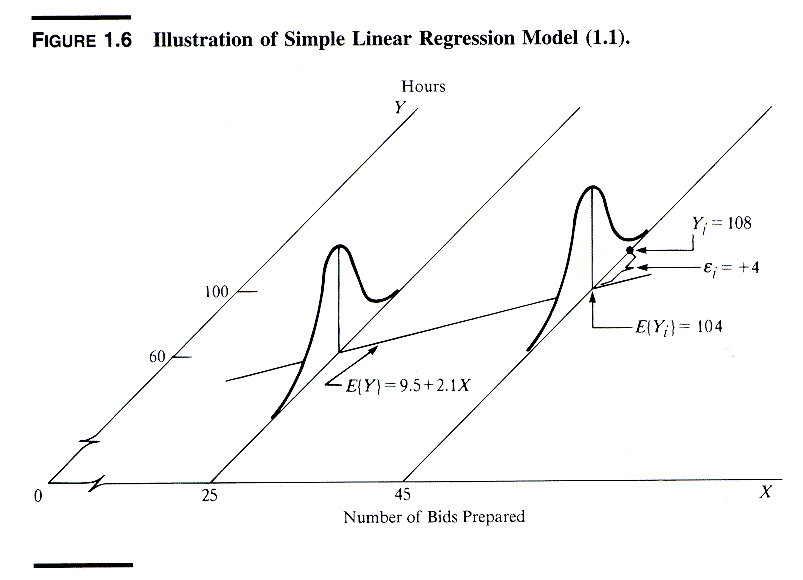
Source: http://www.unc.edu/~nielsen/soci709/m1/m1005.gif
When we have more than one predictor, we call it multiple linear regression:
Y = β0 + β1X1+ β2X2+ β2X3+… + βkXk
The fitted values (i.e., the predicted values) are defined as those values of Y that are generated if we plug our X values into our fitted model.
The residuals are the fitted values minus the actual observed values of Y.
Here is an example of a linear regression with two predictors and one outcome:
Instead of the "line of best fit," there is a "plane of best fit."
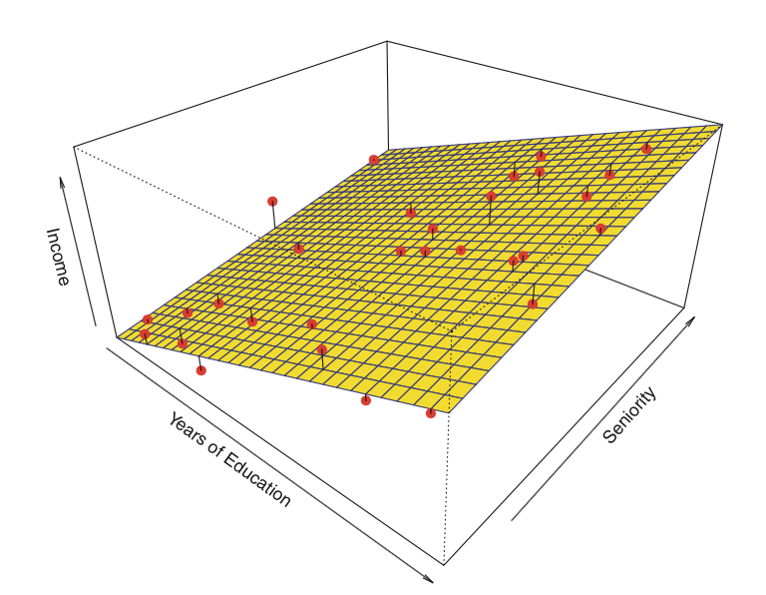
Source: James et al. Introduction to Statistical Learning (Springer 2013)
There are four assumptions associated with a linear regression model:
- Linearity: The relationship between X and the mean of Y is linear.
- Homoscedasticity: The variance of residual is the same for any value of X.
- Independence: Observations are independent of each other.
- Normality: For any fixed value of X, Y is normally distributed.
We will review how to assess these assumptions later in the module.
Let's start with simple regression. In R, models are typically fitted by calling a model-fitting function, in our case lm(), with a "formula" object describing the model and a "data.frame" object containing the variables used in the formula. A typical call may look like
> myfunction <- lm(formula, data, …)
and it will return a fitted model object, here stored as myfunction. This fitted model can then be subsequently printed, summarized, or visualized; moreover, the fitted values and residuals can be extracted, and we can make predictions on new data (values of X) computed using functions such as summary(), residuals(),predict(), etc. Next, we will look at how to fit a simple linear regression.
