

Two-Factor ANOVA
The ANOVA tests described above are called one-factor ANOVAs. There is one treatment or grouping factor with k>2 levels and we wish to compare the means across the different categories of this factor. The factor might represent different diets, different classifications of risk for disease (e.g., osteoporosis), different medical treatments, different age groups, or different racial/ethnic groups. There are situations where it may be of interest to compare means of a continuous outcome across two or more factors. For example, suppose a clinical trial is designed to compare five different treatments for joint pain in patients with osteoarthritis. Investigators might also hypothesize that there are differences in the outcome by sex. This is an example of a two-factor ANOVA where the factors are treatment (with 5 levels) and sex (with 2 levels). In the two-factor ANOVA, investigators can assess whether there are differences in means due to the treatment, by sex or whether there is a difference in outcomes by the combination or interaction of treatment and sex. Higher order ANOVAs are conducted in the same way as one-factor ANOVAs presented here and the computations are again organized in ANOVA tables with more rows to distinguish the different sources of variation (e.g., between treatments, between men and women). The following example illustrates the approach.
Example:
Consider the clinical trial outlined above in which three competing treatments for joint pain are compared in terms of their mean time to pain relief in patients with osteoarthritis. Because investigators hypothesize that there may be a difference in time to pain relief in men versus women, they randomly assign 15 participating men to one of the three competing treatments and randomly assign 15 participating women to one of the three competing treatments (i.e., stratified randomization). Participating men and women do not know to which treatment they are assigned. They are instructed to take the assigned medication when they experience joint pain and to record the time, in minutes, until the pain subsides. The data (times to pain relief) are shown below and are organized by the assigned treatment and sex of the participant.
Table of Time to Pain Relief by Treatment and Sex
|
Treatment |
Male |
Female |
|---|---|---|
|
A |
12 |
21 |
|
15 |
19 |
|
|
16 |
18 |
|
|
17 |
24 |
|
|
14 |
25 |
|
|
B |
14 |
21 |
|
17 |
20 |
|
|
19 |
23 |
|
|
20 |
27 |
|
|
17 |
25 |
|
|
C |
25 |
37 |
|
27 |
34 |
|
|
29 |
36 |
|
|
24 |
26 |
|
|
22 |
29 |
The analysis in two-factor ANOVA is similar to that illustrated above for one-factor ANOVA. The computations are again organized in an ANOVA table, but the total variation is partitioned into that due to the main effect of treatment, the main effect of sex and the interaction effect. The results of the analysis are shown below (and were generated with a statistical computing package - here we focus on interpretation).
ANOVA Table for Two-Factor ANOVA
|
Source of Variation |
Sums of Squares (SS) |
Degrees of freedom (df) |
Mean Squares (MS) |
F |
P-Value |
|---|---|---|---|---|---|
|
Model |
967.0 |
5 |
193.4 |
20.7 |
0.0001 |
|
Treatment |
651.5 |
2 |
325.7 |
34.8 |
0.0001 |
|
Sex |
313.6 |
1 |
313.6 |
33.5 |
0.0001 |
|
Treatment * Sex |
1.9 |
2 |
0.9 |
0.1 |
0.9054 |
|
Error or Residual |
224.4 |
24 |
9.4 |
||
|
Total |
1191.4 |
29 |
There are 4 statistical tests in the ANOVA table above. The first test is an overall test to assess whether there is a difference among the 6 cell means (cells are defined by treatment and sex). The F statistic is 20.7 and is highly statistically significant with p=0.0001. When the overall test is significant, focus then turns to the factors that may be driving the significance (in this example, treatment, sex or the interaction between the two). The next three statistical tests assess the significance of the main effect of treatment, the main effect of sex and the interaction effect. In this example, there is a highly significant main effect of treatment (p=0.0001) and a highly significant main effect of sex (p=0.0001). The interaction between the two does not reach statistical significance (p=0.91). The table below contains the mean times to pain relief in each of the treatments for men and women (Note that each sample mean is computed on the 5 observations measured under that experimental condition).
Mean Time to Pain Relief by Treatment and Gender
|
Treatment |
Male |
Female |
|---|---|---|
|
A |
14.8 |
21.4 |
|
B |
17.4 |
23.2 |
|
C |
25.4 |
32.4 |
Treatment A appears to be the most efficacious treatment for both men and women. The mean times to relief are lower in Treatment A for both men and women and highest in Treatment C for both men and women. Across all treatments, women report longer times to pain relief (See below).
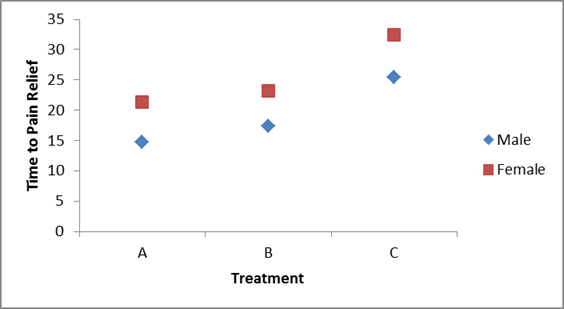
Notice that there is the same pattern of time to pain relief across treatments in both men and women (treatment effect). There is also a sex effect - specifically, time to pain relief is longer in women in every treatment.
Suppose that the same clinical trial is replicated in a second clinical site and the following data are observed.
Table - Time to Pain Relief by Treatment and Sex - Clinical Site 2
|
Treatment |
Male |
Female |
|---|---|---|
|
A |
22 |
21 |
|
25 |
19 |
|
|
26 |
18 |
|
|
27 |
24 |
|
|
24 |
25 |
|
|
B |
14 |
21 |
|
17 |
20 |
|
|
19 |
23 |
|
|
20 |
27 |
|
|
17 |
25 |
|
|
C |
15 |
37 |
|
17 |
34 |
|
|
19 |
36 |
|
|
14 |
26 |
|
|
12 |
29 |
The ANOVA table for the data measured in clinical site 2 is shown below.
Table - Summary of Two-Factor ANOVA - Clinical Site 2
|
Source of Variation |
Sums of Squares (SS) |
Degrees of freedom (df) |
Mean Squares (MS) |
F |
P-Value |
|---|---|---|---|---|---|
|
Model |
907.0 |
5 |
181.4 |
19.4 |
0.0001 |
|
Treatment |
71.5 |
2 |
35.7 |
3.8 |
0.0362 |
|
Sex |
313.6 |
1 |
313.6 |
33.5 |
0.0001 |
|
Treatment * Sex |
521.9 |
2 |
260.9 |
27.9 |
0.0001 |
|
Error or Residual |
224.4 |
24 |
9.4 |
||
|
Total |
1131.4 |
29 |
Notice that the overall test is significant (F=19.4, p=0.0001), there is a significant treatment effect, sex effect and a highly significant interaction effect. The table below contains the mean times to relief in each of the treatments for men and women.
Table - Mean Time to Pain Relief by Treatment and Gender - Clinical Site 2
|
Treatment |
Male |
Female |
|---|---|---|
|
A |
24.8 |
21.4 |
|
B |
17.4 |
23.2 |
|
C |
15.4 |
32.4 |
Notice that now the differences in mean time to pain relief among the treatments depend on sex. Among men, the mean time to pain relief is highest in Treatment A and lowest in Treatment C. Among women, the reverse is true. This is an interaction effect (see below).
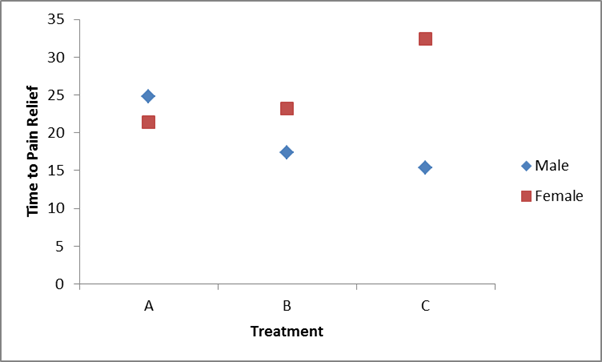
Notice above that the treatment effect varies depending on sex. Thus, we cannot summarize an overall treatment effect (in men, treatment C is best, in women, treatment A is best).
When interaction effects are present, some investigators do not examine main effects (i.e., do not test for treatment effect because the effect of treatment depends on sex). This issue is complex and is discussed in more detail in a later module.