


Graphical Summaries for Discrete Variables
Bar Charts for Dichotomous and Categorical Variables
Graphical displays are very useful for summarizing data, and both dichotomous and non-ordered categorical variables are best summarized with bar charts. The response options (e.g., yes/no, present/absent) are shown on the horizontal axis and either the frequencies or relative frequencies are plotted on the vertical axis. Figure 1 below is a frequency bar chart which corresponds to the tabular presentation in Table 1 above.
Figure 1 - Frequency Bar Chart
Note that for dichotomous and categorical variables there should be a space in between the response options. The analogous graphical representation for an ordinal variable does not have spaces between the bars in order to emphasize that there is an inherent order.
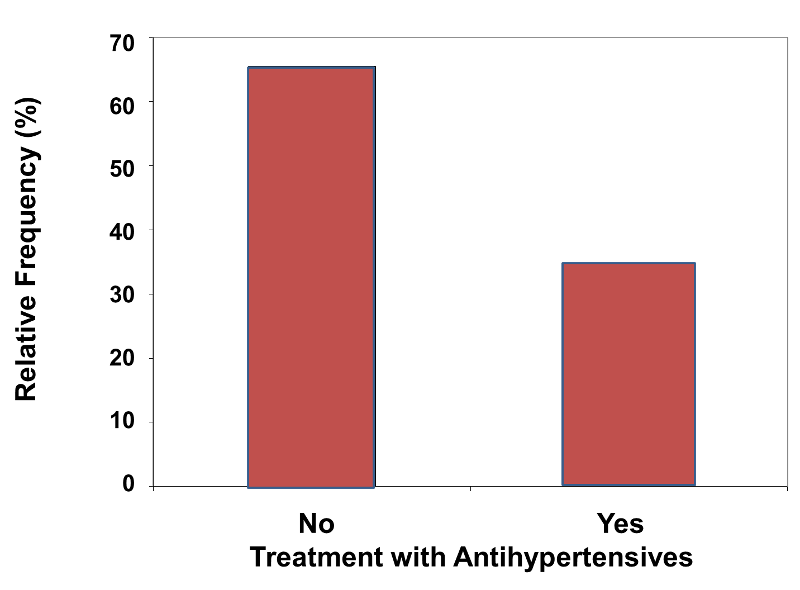
In contrast, figure 2 below illustrates a relative frequency bar chart of the distribution of treatment with antihypertensive medications. This graphical representation corresponds to the tabular presentation in the last column of Table 2 above.
Figure 2 - Relative Frequency Bar Chart
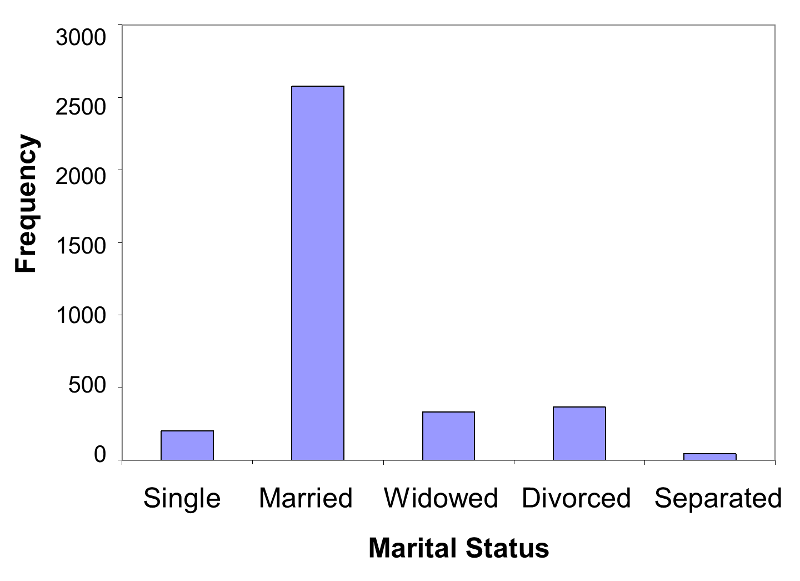
A frequency bar chart for marital status might look like Figure 3 below.
Figure 3
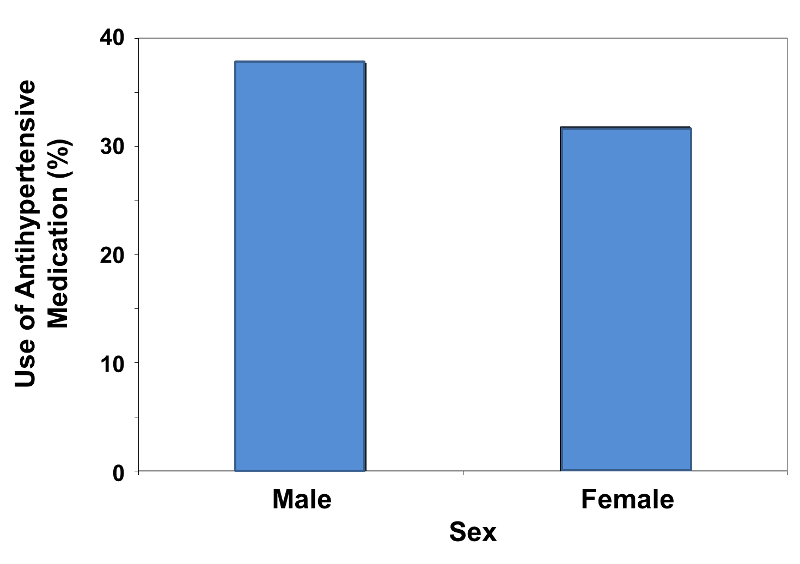
Consider the graphical representation of the data in Table 3 above, comparing the relative frequency of antihypertensive medications between men and women. It would appropriately look like the figure shown below. Note that a range of 0 - 40 was chosen for the vertical axis.
Figure 4
![]() Pitfall:
Pitfall:
For the example above the relative frequencies are 31.8% and 37.7%, so scaling the vertical axis from 0 to 40% is appropriate to accommodate the data. However, one can visually mislead the reader regarding the comparison by using a vertical scale that is either too expansive or too restrictive. Consider the two bar charts below (Figures 5 & 6).
Figure 5
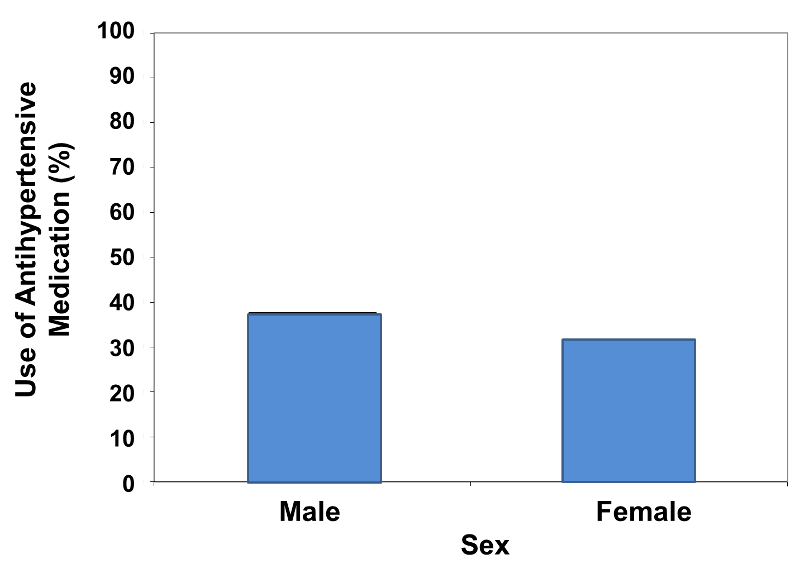
Figure 6
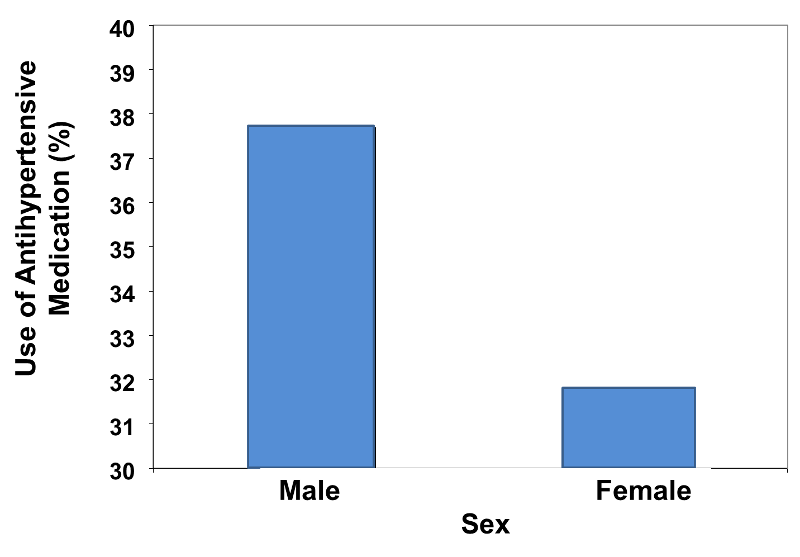
These bar charts display the same relative frequencies, i.e., 31.8% and 37.7%. However, the bar chart on the left minimizes the difference, because the vertical scale is too expansive, ranging from 0 - 100%. On the other hand, the bar chart on the right visually exaggerates the difference, because the vertical scale is too restrictive, ranging from 30 - 40%.
Histograms for Ordinal Variables
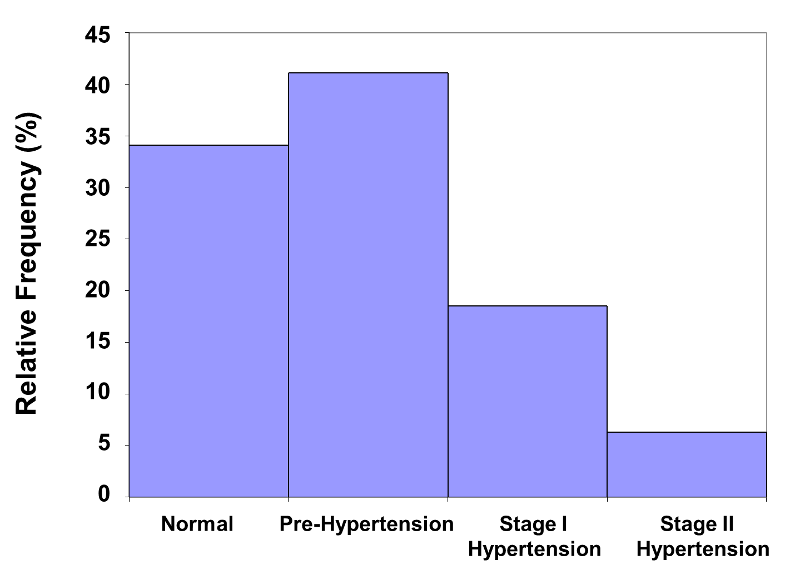
A distinguishing feature of bar charts for dichotomous and non-ordered categorical variables is that the bars are separated by spaces to emphasize that they describe non-ordered categories. When one is dealing with ordinal variables, however, the appropriate graphical format is a histogram. A histogram is similar to a bar chart, except that the adjacent bars abut one another in order to reinforce the idea that the categories have an inherent order. The frequency histogram below summarizes the blood pressure data that was presented in a tabular format in Table 4 on the previous page. Note that the vertical axis displays the frequencies or numbers of participants classified in each category.
Figure 7 Frequency Histogram for Blood Pressure
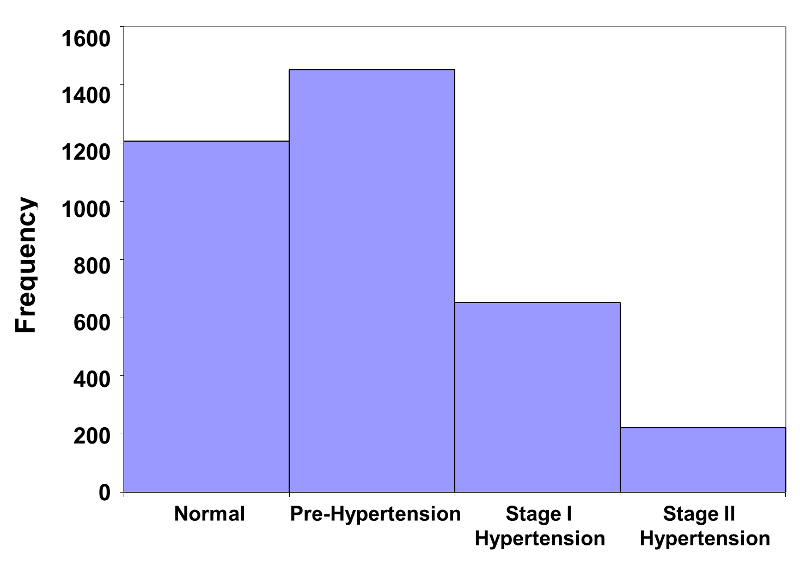
This histogram immediately conveys the message that the majority of participants are in the lower two categories of the distribution. A small number of participants are in the Stage II hypertension category. The histogram below is a relative frequency histogram for the same data. Note that the figure is the same, except for the vertical axis, which is scaled to accommodate relative frequencies instead of frequencies.
Figure 8 - Relative Frequency Histogram for Blood Pressure