

A Stratified Analysis
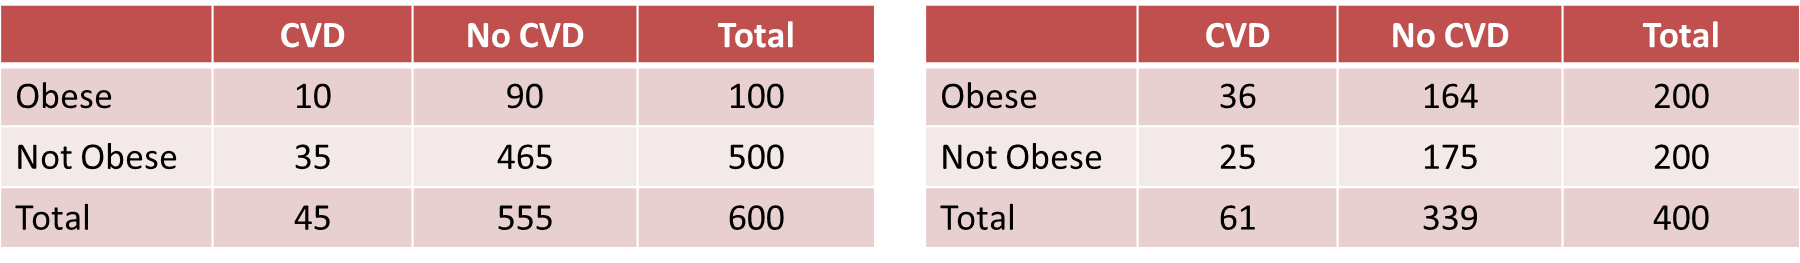
One way of identifying confounding is to examine the primary association of interest at different levels of a potential confounding factor. The side by side tables below examine the relationship between obesity and incident CVD in persons less than 50 years of age and in persons 50 years of age and older, separately.
|
Baseline Obesity and Incident CVD by Age Group |
|
|
Age < 50 |
Age 50+ |
|
|
|
|
Among those < 50, the risk ratio is: RR = (10/100) / (35/500) = 0.100/0.070 = 1.43 |
Among those 50+, the risk ratio is: RR = (36/200) / 25/200 = 0.180 / 0.125 = 1.44 |
Recall that the risk ratio for the total combined sample was RR = 1.79; this is sometimes referred to as the "crude" measure of association, because it is not adjusted for potential confounding factors. The risk ratios for the age-stratified analysis are similar to each other (RR = 1.43 and 1.44, respectively), but less than the crude risk ratio. This indicates that there was confounding by age in the overall sample. We saw that obese subjects more likely to be older than 50, and we also saw that those over age 50 had a greater risk of CVD. As a result, the crude analysis overestimated the true association between obesity (per se) and CVD, because of the greater proportion of older subjects among the obese group.
The Cochran-Mantel-Haenszel Method
In the example above we saw that the relationship between obesity and CVD was confounded by age. When all of the data was pooled, it appeared that the risk ratio for the association between obesity and CVD was 1.79. However, when we stratified the analysis into those age <50 and those age 50+, we saw that both groups had a risk ratio of about 1.43. The distortion was due to the fact that obese individuals tended to be older, and older age is an independent risk factor for CVD. Consequently, in the analysis using the combined data set, the obese group had the added burden of an additional risk factor.
The Cochran-Mantel-Haenszel method is a technique that generates an estimate of an association between an exposure and an outcome after adjusting for or taking into account confounding. The method is used with a dichotomous outcome variable and a dichotomous risk factor. We stratify the data into two or more levels of the confounding factor (as we did in the example above). In essence, we create a series of two-by-two tables showing the association between the risk factor and outcome at two or more levels of the confounding factor, and we then compute a weighted average of the risk ratios or odds ratios across the strata (i.e., across subgroups or levels of the confounder).
Data Layout for Cochran-Mantel-Haenszel Estimates
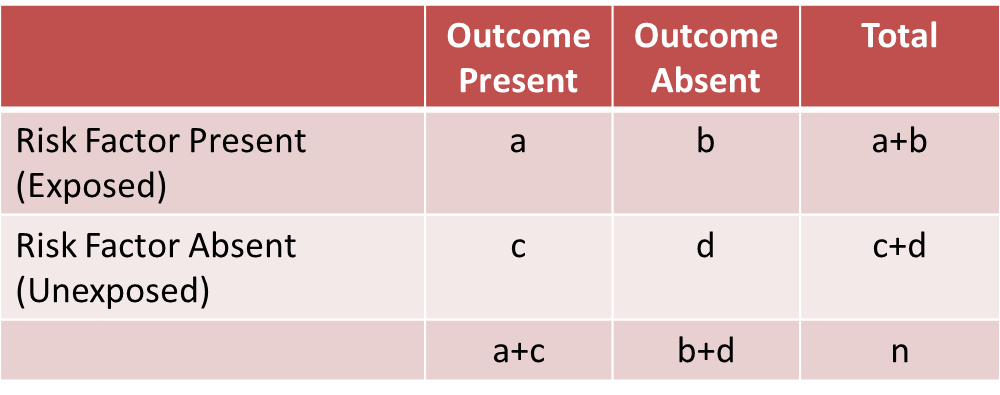
Before computing a Cochran-Mantel-Haenszel Estimate, it is important to have a standard layout for the two by two tables in each stratum. We will use the general format depicted here:
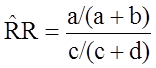
Using the notation in this table estimates for a risk ratio or an odds ratio would be computed as follows:
|
Risk Ratio
|
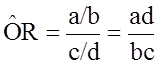
Odds Ratio
|
To explore and adjust for confounding, we can use a stratified analysis in which we set up a series of two-by-two tables, one for each stratum (category) of the confounding variable. Having done that, we can compute a weighted average of the estimates of the risk ratios or odds ratios across the strata. The weighted average provides a measure of association that is adjusted for confounding. The weighted averages for risk ratios and odds ratios are computed as follows:
|
Cochran-Mantel-Haenszel Estimate for a Risk Ratio |
Cochran-Mantel-Haenszel Estimate for an Odds Ratio |
|---|---|
|
|
|
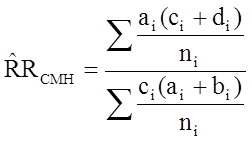
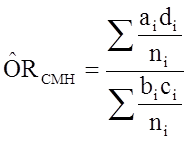
Where ai, bi, ci and di are the numbers of participants in the cells of the two-by-two table in the ith stratum of the confounding variable. ni represents the number of participants in the ith stratum.
To illustrate the computations, we can use the previous example examining the association between obesity and CVD, which we stratified into two categories: those with age <50 and those who were 50+ at baseline:
|
Baseline Obesity and Incident CVD by Age Group |
|
|
Age < 50 |
Age 50+ |
|
|
|
|
Among those < 50, the risk ratio is: RR = (10/100) / (35/500) = 0.100/0.070 = 1.43 |
Among those 50+, the risk ratio is: RR = (36/200) / 25/200 = 0.180 / 0.125 = 1.44 |
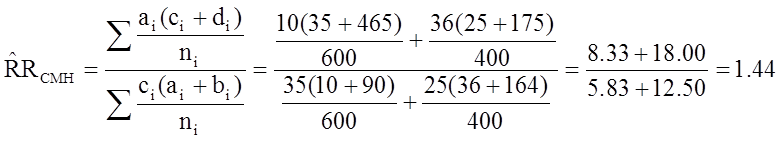
From the stratified data we can also compute the Cochran-Mantel-Haenszel estimate for the risk ratio as follows:
If we chose to, we could also use the same data set to compute a crude odds ratio (crude OR = 1.93) and we could also compute stratum-specific odds ratios as follows:
|
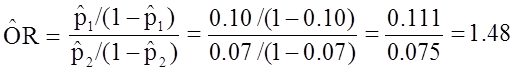
Among people of age <50 the odds ratio is:
|
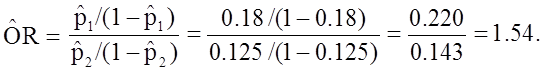
Among people whose age was 50+ the odds ratio is:
|
And, using the same data we could also compute the Cochran-Mantel-Haenszel estimate for the odds ratio as follows:
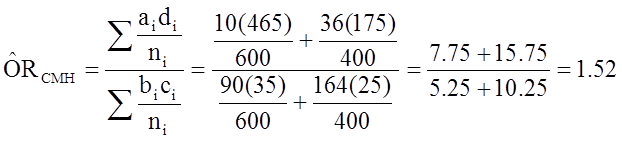
The Cochran-Mantel-Haenszel method produces a single, summary measure of association which accounts for the fact that there is a different association in each age stratum. Notice that the adjusted relative risk and adjusted odds ratio, 1.44 and 1.52, are not equal to the unadjusted or crude relative risk and odds ratio, 1.78 and 1.93. The adjustment for age produces estimates of the relative risk and odds ratio that are much closer to the stratum-specific estimates (the adjusted estimates are weighted averages of the stratum-specific estimates).