

Confounding
Confounding is a distortion (inaccuracy) in the estimated measure of association that occurs when the primary exposure of interest is mixed up with some other factor that is associated with the outcome.
There are three conditions that must be present for confounding to occur:
- The confounding factor must be associated with both the risk factor of interest and the outcome.
- The confounding factor must be distributed unequally among the groups being compared.
- A confounder cannot be an intermediary step in the causal pathway from the exposure of interest to the outcome of interest.
Since most health outcomes have multiple contributing causes, there are many possible confounders. For example, a study looking at the association between obesity and heart disease might be confounded by age, diet, smoking status, and a variety of other risk factors that might be unevenly distributed between the groups being compared.
Suppose a prospective cohort study was used to assess the association between obesity (defined as BMI > 30 at baseline) and the incidence of cardiovascular disease. Data are collected on participants between the ages of 35 and 65 who are initially free of cardiovascular disease (CVD) and followed over ten years. The table below summarizes the findings.
|
|
Incident CVD |
No CVD |
Total |
|
Obese |
46 |
254 |
300 |
|
Not Obese |
60 |
640 |
700 |
|
Total |
106 |
894 |
1,000 |
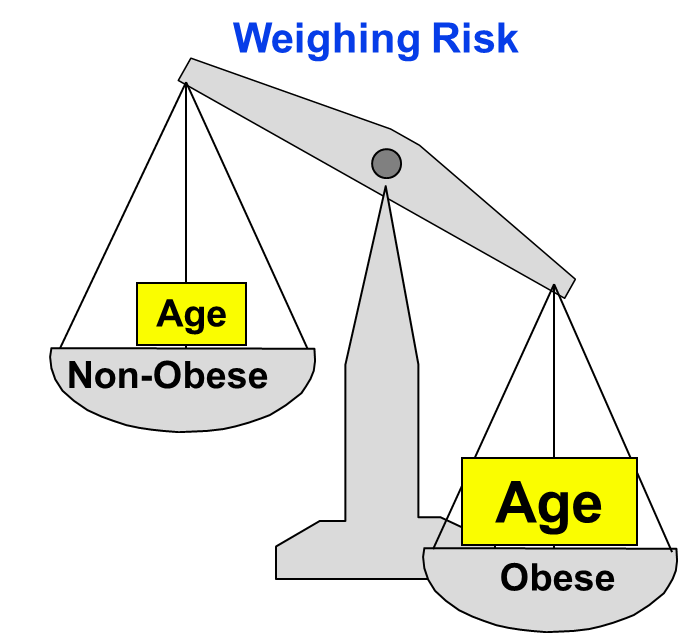
The cumulative incidence of CVD in obese persons) is 46/300 = 0.1533, and the cumulative incidence in non-obese persons is 60/700 = 0.0857. The estimated risk ratio for CVD in obese as compared to non-obese persons is RR = 0.153/0.86 = 1.79, suggesting that obese persons are 1.79 times as likely to develop CVD compared to non-obese persons. However, it is well known that the risk of CVD also increases with age, and BMI tends to increase with age. Could any (or all) of the apparent association between obesity and incident CVD be attributable to age?
If the obese group in our sample is older than the non-obese group, then all or part of the increased CVD risk in obese persons could possibly due to the increase in age rather than their obesity. If age is another risk factor for CVD, and if obese and non-obese persons differ in age, then our estimate of the association between obesity and CVD will be overestimated, because of the additional burden of being older.
In fact, in this data set, subjects who were 50+ were more likely to be obese (200/400 = 0.500) as compared to subjects younger than (100/600=0.167), as demonstrated by the table below.
|
|
Obese |
Not Obese |
Total |
|
Age 50+ |
200 |
200 |
400 |
|
Age <50 |
100 |
500 |
600 |
|
Total |
300 |
700 |
1000 |
In addition, older subjects were more likely to develop CVD (65/400 = 0.1625 versus 45/600 = 0.075).
|
|
Incident CVD |
No CVD |
Total |
|
Age 50+ |
65 |
335 |
400 |
|
Age < 50 |
45 |
555 |
600 |
|
Total |
110 |
890 |
1000 |
Thus, age meets the definition of a confounder (i.e., it is associated with the primary risk factor(obesity) and the outcome (CVD).
Determining Whether a Variable is a Confounder
There are different methods to determine whether a variable is a confounder or not.
- Some investigators perform formal tests of hypothesis to assess whether the variable is associated with the risk factor and with the outcome. To see how to do this for determining whether age is a confounder for the association between obesity and CVD, follow this link.
- Other investigators do not conduct statistical tests but instead inspect the data, and, if there is a practically important or clinically meaningful relationship between the variable and the risk factor and between the variable and the outcome (regardless of whether that relationship reaches statistical significance), the variable is said to be a confounder.
- Still other investigators determine whether there is confounding by estimating the measure of association before and after adjusting for a potential confounding variable. A change in the estimated measure of association of 10% or more would be evidence that confounding was present, but if the measure of association changes by <10%, there is likely to be little, if any, confounding by that variable. Using the example above, the adjusted risk ratio would be about 1.43 and the crude risk ratio (before adjustment) = 1.78. So the % difference = (1.78-1.43)/1.43 = 24.5% difference. Therefore, there was confounding by age. This is discussed further in the section on multiple linear regression later in this module.
Lisa: Is hypothesis testing really a good way to approach this? If the sample size is small, hypothesis testing might fail to reject the null hypothesis, but there still might be confounding.