MDPH Response and
Standardized Rates of Disease
In December 1979 the CDC, at the urging of Jimmy's doctor, asked the city of Woburn for permission to investigate the possible leukemia cluster. The lead investigator was hesitant that epidemiological investigations would yield any answers to childhood leukemia, because the techniques were crude and the disease too rare to establish a firm connection between cause and effect. Despite these concerns, the CDC moved forward with its investigation. Jonathan Harr described the planning of the study as follows:
- The study was to be conducted over one year.
- Trained researchers would go to the homes of the 12 families with leukemia cases and conduct a detailed interview.
- The researchers would also conduct interviews with 24 other Woburn families who were selected as controls.
- Controls were matched by age and sex with the cases and only one control lived in close proximity to the case.
- The questionnaire included the following topics: demographic information, disease process, past medical history, smoking, residence, schooling, occupational histories, and environmental exposures.
Woburn Health Data Analysis
On December 21, 1979 the Massachusetts Department of Public Health published the Woburn Health Data Analysis, 1969-1978, a study of cancer mortality led by Milt Kotelchuck.
Below are a series of questions that summarize the key takeaway points from the MDPH report by Kotelchuck and Parker. Select the question to reveal the answer. Try and answer the questions prior to revealing the correct responses.
1. What was the primary outcome of interest? Why was it chosen?
The primary outcome of interest was cancer mortality. It was chosen because, at the time, it was the only available data. They did not have data on incidence of cancer, because the Cancer Registry had not yet begun.
2. What was the primary source of data regarding the outcome of interest? What were the limitations to using this source of data?
Death certificates were the primary source of data regarding cancer mortality. There were many limitations to using death certificates. There is limited data available on death certificates and cause of death is simply what the physician chose to put down. There is/were no standardized criteria for deciding actual cause of death. In fact, since death was declared after an individual's heart stopped and respirations ceased, many physicians tended to enter cardiopulmonary collapse as a cause of death. There is a substantial risk of misclassification of cause of death.
Another big limitation is that mortality from cancer is a poor measure on incidence. For example, people with pre-existing cancer might have moved to Woburn and then died while they were residents. Finally, there was so little information on a death certificate that is was not possible to adjust for many possible confounding factors including smoking, drinking, and obesity.
3. What was the exposure of interest for this study?
The exposure was living in Woburn during the period 1974-1978.
4. Did the authors present a clear indication of the methods used in gathering and analyzing these data?
No. This is apparently a report that was issued primarly for the general public. There really isn't much about the details of how the study was done. We don't know what information was available on the death certificates. The report states that Woburn had an elevated cancer rate based on having more observed cancer deaths than expected, but we don't know what the comparison group was (US cancer death rates overall? MA death rates overall?), and we don't know how they computed this or whether they adjusted for differences in age and gender. If Woburn's population had an age distribution greater than that of the comparison group, then it might not be surprising that they had more cancer cases.
5. The authors say, "Woburn has one of the higher cancer rates (ratio of observed to expected deaths) among Massachusetts communities." How precise is this definition of cancer rate?
They really didn't measure the rate at which new cancers were occurring. They compared the observed number of cancer deaths to the number of deaths expected if Woburn had had the same rate as the comparison group. Moreover, they were looking at cancer deaths, not cancer incidence.
More information on how they measured cancer deaths is available under Standardized Rates of Disease.
6. The authors indicated that the overall cancer mortality rate was higher in Woburn during the period from 1974-1978, and when they looked at mortality rates for specific types of cancer, there were some that were significantly elevated, such as bronchus/lung, breast, prostate, kidney, and liver cancers, but others that were not. What do they mean when they say that the mortality rates for some cancers were significantly elevated, and how did they determine this?
They didn't state how they determined significance. Presumably, they used a p-value less than 0.05 as the criterion for significance, but this isn't stated, and it would have been more informative if they had provided confidence intervals for their estimates.
If, in fact, there had been statistically significant differences in one or more of the specific cancers, the ability to detect those differences would be dependent on the number of cases and the size of the population (i.e., the statistical power of the study), but the reader can't evaluate that.
7. How do the findings in the study contribute to our understanding of the leukemia cases that had been found among children living in Woburn?
The finding of a greater number of cancer deaths in Woburn is certainly of concern, but they did not find an unusually high rate of leukemia deaths. Consequently, the study does not really contribute much to our understanding of the cause of leukemia cases.
8. What additional information would have been desirable in assessing a possible increased incidence of leukemia in Woburn?
As the authors acknowledge, cancer death rates are not necessarily a good surrogate marker for cancer risk, and the use of data from death certificates could have resulted in misclassification of outcomes. It would have been much better to have addressed this preliminary report with accurate data on cancer incidence. One of the good things that came out of these investigations in Woburn is that they underscored the need for a cancer registry in Massachusetts. The Massachusetts legislature established a registry in July 1980.
The aggressive efforts by Reverend Young to find all of the leukemia cases had successfully identified all 12 incidences of leukemia that occurred during this 15-year period. However, the problem was that there was no way of knowing whether this incidence was unusual, since there was no data on cancer incidence in other communities in Massachusetts. As a result, the key question about whether 12 leukemia cases in a 15-year period was unusual remained unanswered. The lack of data on incident cases of cancer was a major limitation, and the following year the Massachusetts Cancer Registry was created and began to collect the data necessary to answer questions like this.
Cancer Incidence and Environmental Hazards
Jimmy Anderson died on January 18, 1981. Five days later the Massachusetts Department of Public Health and CDC released an additional study referred to as Cancer Incidence and Environmental Hazards The study concluded that the incidence of childhood leukemia in Woburn was significantly greater than expected. This study got around the lack of information in the rest of the state by using age- and sex-specific incidence data from the Third National Cancer Survey (TNCS). The key data for this comparison are summarized in Table 5 at the end of the study shown in the image below.
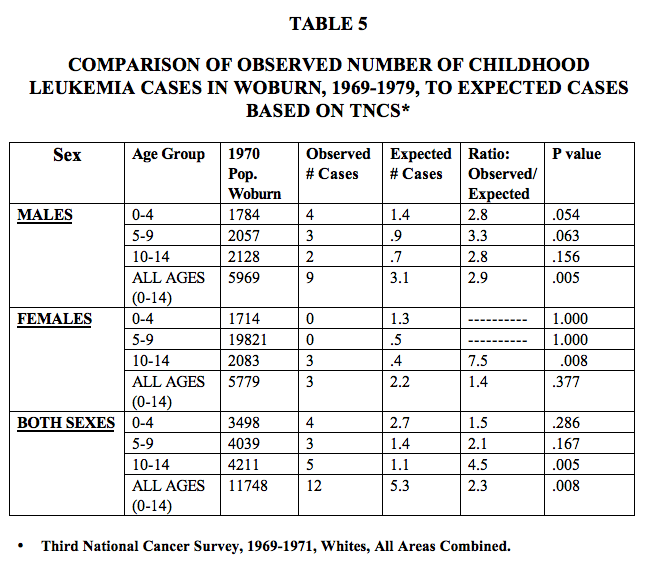
In contrast to the report by Kotelchuck and Parker, this study by Gerald Parker and Sharon Rosen concluded, " ...that there was a significantly elevated incidence of childhood leukemia in Woburn for the period 1969-1979. Twelve cases were observed whereas 5.3 cases were expected." In addition, "The incidence of renal cancer in Woburn was also significantly elevated for the period 1979-1978. Thirty cases were observed whereas 19.4 were expected.
Below are a series of questions that summarize the key takeaway points from the MDPH report by Parker and Rosen. Select the question to reveal the answer. Try and answer the questions prior to revealing the correct responses.
1. What kind of study design was this? Why was this study design employed? Who were the subjects?
The first part of the study compared the observed number of cancers to the numbers that would have been expected based on the cancer rates observed using age- and sex-specific incidence data from the Third National Cancer Survey (TNCS). In this method the investigators compute a standardized incidence ratio to compare the number of observed events to the number that were expected. This is often referred to as indirect standardization and it is described with an example on page 6 of our online module on Standardized Rates. Data from the TNCS is not the ideal standard for comparison for an individual community in Massachusetts, since environment conditions across the United States differ widely. It would have been better to use Massachusetts statewide data for comparison. However, Massachusetts did not have a cancer registry at the time, so data on the incidence of cancers in the state was unavailable.
The second phase of the study was a series of case-control studies looking for associations between environmental factors and each of several cancer types.
2. In this study how were cases defined, and how did the investigators go about finding the cases? How did this differ from the earlier report by Kotelchuck and Parker?
A leukemia case was defined as a person with confirmed childhood leukemia [up to age 20] who was diagnosed with the disease between 1969-1979 and who was a resident of Woburn at the time of diagnosis. The earlier study by Kotelchuck and Parker defined leukemia cases as children who had died from leukemia. If you are trying to ascertain the cause of the leukemias, it is obviously better to use leukemia incidence as the outcome instead of leukemia mortality. However, the earlier study was very limited by the data that was available at the time.
3. Why did the investigators select two age- and sex-matched controls for each case, i.e., one who lived close to the case and one who lived elsewhere in Woburn?
The investigators did this to minimize selection bias. Since there were suggestions of a cluster of cases in the eastern part of the town and a possibility that they were caused by a local environmental exposure (e.g., water from wells G and H), they wanted to select non-disease controls who lived elsewhere in Woburn. On the other hand, if the cancer cases were caused by some other exposure that did not vary by location, they also wanted to have controls who were matched by neighborhood.
4. With respect to childhood leukemia, how was data regarding the health outcome of interest collected? How was the data regarding exposures collected? What is your assessment of these methods of data collection?
Death certificates, informants, and hospital records were used to identify leukemia cases. For leukemia cases and controls exposure data were collected during face to face interviews with the parents of the subjects. In this setting there is certainly the potential for recall bias, since the parents of children with leukemia may have remembered their child's past exposures differently than the parents of non-diseased children. In addition, although it is not stated, it is very unlikely that the interviewers were blinded regarding the disease status of the subjects, so there is also a possibility of interviewer bias.
5. Why was an analysis based on the binomial distribution used, and what does this mean? There were 12 leukemia cases in the 0-14 year age group in Woburn, and 6 off them occurred in an area in which only 17% of the children in this age group lived?
The authors stated, "An analysis of residence at the time of diagnosis of the leukemia cases shows a concentration of cases in the eastern part of Woburn, in particular in the area just north of Walker Pond. Map 2 displays Woburn's six census tracts, and the number of cases in each tract. Six cases resided within or on the border of census tract 3334, in an area of approximately ½ mile in radius. There is a statistically significant concentration of cases in this census tract; the probability of 50% or more of the 12 cases occurring in this area, which contains only 17% of the town's 0-14 age group population is less than .01 (Binomial distribution with parameters 12 and 17).
Use the binomial probability calculator below to compute the probability of having 6 or more leukemia cases clustered in this small section of Woburn?
It is important to realize that useful information and insight on a given public health problem can take years to unveil and rarely does that information provide clear, definitive answers. Assistant Commissioner Gerald Parker describes the context of the DPH Woburn Study and how difficult it is for epidemiological research to discover the causes of disease. This uncertainty would prove unnerving for many citizens of Woburn...
Standardized Rates of Disease
A key question for Woburn was whether or not the community was experiencing an unusually high frequency of leukemia (or other diseases). One strategy for doing this is to compare the incidence of a particular disease in a community to the incidence of that disease in other communities or relative to the overall rates seen in the state or in the country. However, comparisons like this can be distorted by confounding factors, such as age and gender.
When comparing overall rates of cancer mortality in Town A to that of Town B, it turns out the cancer mortality is greater in Town B. Town A is known for being a young, artsy college town whereas Town B has several active living communities for adults 55+.
Can one conclude that Town B has a higher cancer mortality due to an environmental risk factor?
When comparing rates of disease among communities, the problem of confounding by age or gender can be dealt with by computing age-standardized rates separately for males and females. There are two techniques for doing this: age-adjusted standardized rates and standardized incidence ratios.
Standardized Incidence Ratios (SIRs)
Standardized incidence ratios (SIRs) are particularly useful when dealing with relatively uncommon diseases, such as leukemia. The strategy for SIRs is to compare the number of observed cases of disease to the number of cases that would have been expected if the community's rate of disease were the same as the overall rate for the state. Consequently, an important application of SIRs is to monitor the frequency of cancer and other diseases in individual communities. The Massachusetts Cancer Registry was established in 1980, partly in response to the childhood leukemia cluster in Woburn.
For more details, you may review the online learning module on Standardized Rates paying particular attention to the section on standardized incidence ratios (page 6). Review the examples in the module on Standardized Rates to familiarize yourself with calculation of an SIR. Then use this information to compute the SIRs for leukemia in male and female children in Woburn in the activity below.
The tables below summarize data that were used for computation of standardized incidence ratios in both the 1981 report (Woburn - Cancer Incidence and Environmental Hazards, 1969-1978) and in a a subsequent article published in 1986 (Cutler JJ, Parker GS, Rosen S , et al.:"Childhood Leukemia in Woburn, Massachusetts." Public Health Reports, March-April 1986; 101(2):201-205). The tables (for males and females) provide age-specific information on populations size, overall rate of leukemia in MA, and the observed number of leukemia cases in Woburn for the period 1969-1979. The numbers of expected cases were determined from the Third National Cancer Survey, 1969-71, as described in the article.
Compute the missing information in the tables below (denoted by a "?"), and use this to compute the SIR for male children and the SIR for female children. Complete your calculations and interpret your findings before looking at the answer.
| Age Group | Popul- ation |
State Rate | Observed Cases | Expected Cases |
|---|---|---|---|---|
| < 5 | 1784 | 0.0008 | 4 | ? |
| 5 - 9 | 2057 | 0.0004 | 3 | ? |
| 10 - 14 | 2128 | 0.0003 | 2 | ? |
| Sum | 5969 | ? |
? |
| Age Group | Population | State Rate | Observed Cases | Expected Cases |
|---|---|---|---|---|
| < 5 | 1714 | 0.0007 | 0 | ? |
| 5 - 9 | 1982 | 0.0004 | 0 | ? |
| 10 - 14 | 2083 | 0.0002 | 3 | ? |
| Sum | 5779 | ? |
? |
The previous analyses suggest that the incidence of childhood leukemia in Woburn from 1969-1976 was unusually high, but failed to establish a connection with environmental hazards.
How do we determine what exposure(s) might be responsible for the poor health outcomes?