


Introduction to Survival Data
Survival analysis focuses on two important pieces of information:
- Whether or not a participant suffers the event of interest during the study period (i.e., a dichotomous or indicator variable often coded as 1=event occurred or 0=event did not occur during the study observation period.
- The follow up time for each individual being followed.
Follow Up Time
Time zero, or the time origin, is the time at which participants are considered at-risk for the outcome of interest. In many studies, time at risk is measured from the start of the study (i.e., at enrollment). In a prospective cohort study evaluating time to incident stroke, investigators may recruit participants who are 55 years of age and older as the risk for stroke prior to that age is very low. In a prospective cohort study evaluating time to incident cardiovascular disease, investigators may recruit participants who are 35 years of age and older. In each of these studies, a minimum age might be specified as a criterion for inclusion in the study. Follow up time is measured from time zero (the start of the study or from the point at which the participant is considered to be at risk) until the event occurs, the study ends or the participant is lost, whichever comes first. In a clinical trial, the time origin is usually considered the time of randomization. Patients often enter or are recruited into cohort studies and clinical trials over a period of several calendar months or years. Thus, it is important to record the entry time so that the follow up time is accurately measured. Again, our interest lies in the time to event but for various reasons (e.g., the participant drops out of the study or the study observation period ends) we cannot always measure time to event. For participants who do not suffer the event of interest we measure follow up time which is less than time to event, and these follow up times are censored.
The Survival Function
In survival analysis, we use information on event status and follow up time to estimate a survival function . Consider a 20 year prospective study of patient survival following a myocardial infarction. In this study, the outcome is all-cause mortality and the survival function (or survival curve) might be as depicted in the figure below.
Sample Survival Curve - Probability Of Surviving
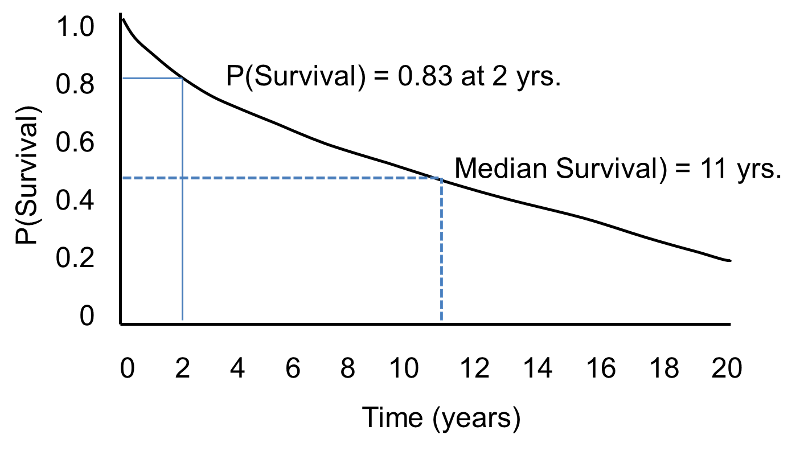
The horizontal axis represents time in years, and the vertical axis shows the probability of surviving or the proportion of people surviving.
- At time zero, the survival probability is 1.0 (or 100% of the participants are alive).
- At 2 years, the probability of survival is approximately 0.83 or 83%.
- At 10 years, the probability of survival is approximately 0.55 or 55%.
- The median survival is approximately 11 years.
A flat survival curve (i.e. one that stays close to 1.0) suggests very good survival, whereas a survival curve that drops sharply toward 0 suggests poor survival.
The figure above shows the survival function as a smooth curve. In most applications, the survival function is shown as a step function rather than a smooth curve (see the next page.)


The figure below shows Kaplan-Meier curves for the cumulative risk of dementia among elderly persons who frequently played board games such as chess, checkers, backgammon, or cards at baseline as compared with subjects who rarely played such games.
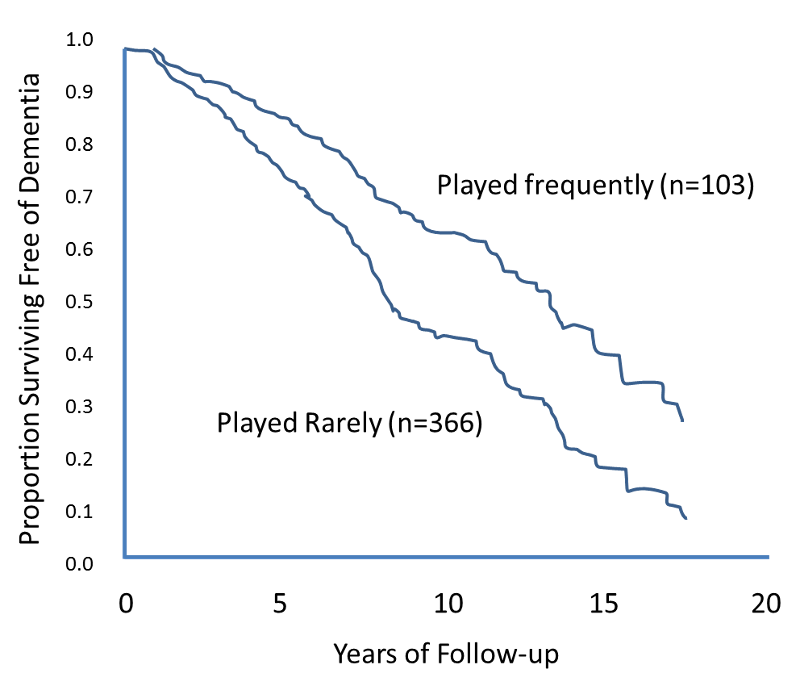
Source: Adapted from Verghese et al.