


Solutions to Selected Problems
Answer to first problems on page 3
What is the 90% confidence interval for BMI? (Note that Z=1.645 to reflect the 90% confidence level.)


So, the 90% confidence interval is (126.77, 127.83)
=======================================================
Answer to BMI Problem on page 3
Question: Using the subsample in the table above, what is the 90% confidence interval for BMI?
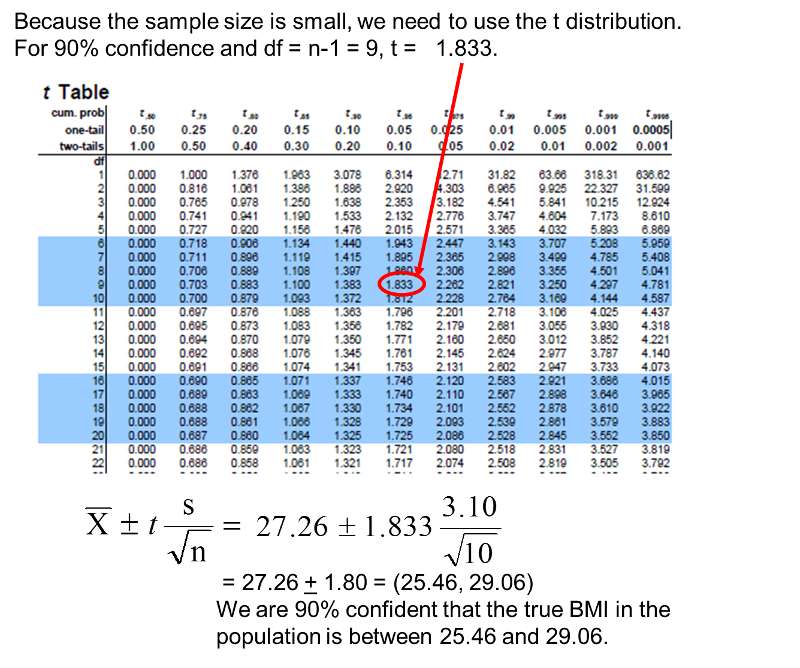
Solution: Once again, the sample size was 10, so we go to the t-table and use the row with 10 minus 1 degrees of freedom (so 9 degrees of freedom). But now you want a 90% confidence interval, so you would use the column with a two-tailed probability of 0.10. Looking down to the row for 9 degrees of freedom, you get a t-value of 1.833.
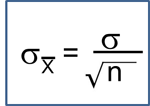
Once again you will use this equation:

Plugging in the values for this problem we get the following expression:
Therefore the 90% confidence interval ranges from 25.46 to 29.06.
=======================================================
Answer to Problem at Bottom of Page 4
The table below, from the 5th examination of the Framingham Offspring cohort, shows the number of men and women found with or without cardiovascular disease (CVD). Estimate the prevalence of CVD in men using a 95% confidence interval.
|
|
Free of CVD |
Prevalent CVD |
Total |
|
Men |
1,548 |
244 |
1,792 |
|
Women |
1,872 |
135 |
2,007 |
|
Total |
3,420 |
379 |
3,799 |
The prevalence of cardiovascular disease (CVD) among men is 244/1792=0.1362. The sample size is large and satisfies the requirement that the number of successes is greater than 5 and the number of failures is greater than 5. Therefore, the following formula can be used again.
Substituting, we get
So, the 95% confidence interval is (0.120, 0.152).
With 95% confidence the prevalence of cardiovascular disease in men is between 12.0 to 15.2%.
=======================================================
Answer to Problem on Confidence Interval for Risk Difference on Page 7
The point estimate for the difference in proportions is (0.46-0.22)=0.24. Note that the new treatment group is group 1, and the standard treatment group is group 2. Therefore, 24% more patients reported a meaningful reduction in pain with the new drug compared to the standard pain reliever. Since there are more than 5 events (pain relief) and non-events (absence of pain relief) in each group, the large sample formula using the z-score can be used.
Substituting we get
This further simplifies to

So, the 96% confidence interval for this risk difference is (0.06, 0.42).
Interpretation: Our best estimate is an increase of 24% in pain relief with the new treatment, and with 95% confidence, the risk difference is between 6% and 42%. Since the 95% confidence interval does not contain the null value of 0, we can conclude that there is a statistically significant improvement with the new treatment.
=======================================================
Answer to Problem on Confidence Interval for Relative Risk - Page 8
Consider again the randomized trial that evaluated the effectiveness of a newly developed pain reliever for patients following joint replacement surgery. Using the data in the table below, compute the point estimate for the relative risk for achieving pain relief, comparing those receiving the new drug to those receiving the standard pain reliever. Then compute the 95% confidence interval for the relative risk, and interpret your findings in words.
|
Treatment Group |
n |
# with Reduction of 3+ Points |
Proportion with Reduction of 3+ Points |
|
New Pain Reliever |
50 |
23 |
0.46 |
|
Standard Pain Reliever |
50 |
11 |
0.22 |
The point estimate for the relative risk is
Patients receiving the new drug are 2.09 times more likely to report a meaningful reduction in pain compared to those receivung the standard pain reliever. The 95% confidence interval estimate can be computed in two steps as follows:

This is the confidence interval for ln(RR). To compute the upper and lower limits for the confidence interval for RR we must find the antilog using the (exp) function:
Therefore, we are 95% confident that patients receiving the new pain reliever are between 1.14 and 3.82 times as likely to report a meaningful reduction in pain compared to patients receiving tha standard pain reliever.
===========================================
Answer to Odds Ratio Problem on Page 10
We now ask you to use these data to compute the odds of pain relief in each group, the odds ratio for patients receiving new pain reliever as compared to patients receiving standard pain reliever, and the 95% confidence interval for the odds ratio.
|
Treatment Group |
n |
# with Reduction of 3+ Points |
Proportion with Reduction of 3+ Points |
|
New Pain Reliever |
50 |
23 |
0.46 |
|
Standard Pain Reliever |
50 |
11 |
0.22 |
It is easier to solve this problem if the information is organized in a contingency table in this way:
|
|
Pain Relief 3+ |
Less Relief |
|---|---|---|
|
New Drug |
23 |
27 |
|
Standard Drug |
11 |
39 |
Odds of pain relief 3+ with new drug = 23/27 0.8519
Odds of pain relief 3+ with standard drug = 11/39 = 0.2821
Odds Ratio = 0.8519 / 0.2821 = 3.02
To compute the 95% confidence interval for the odds ratio we use
Substituting we get

Since we used the log (Ln), we now need to take the antilog to get the limits of the confidente interval.

The point estimate of the odds ratio is OR=3.2, and we are 95% confident that the true odds ratio lies between 1.27 and 7.21. This is statistically significant because the 95% confidence interval does not include the null value (OR=1.0).
Note also that the odds rato was greater than the risk ratio for the same problem. For mathematical reasons the odds ratio tends to exaggerate associates when the outcome is more common.
Answer to Pain Reliever Problem - Page 8
Consider again the randomized trial that evaluated the effectiveness of a newly developed pain reliever for patients following joint replacement surgery. Using the data in the table below, compute the point estimate for the relative risk for achieving pain relief, comparing those receiving the new drug to those receiving the standard pain reliever. Then compute the 95% confidence interval for the relative risk, and interpret your findings in words.
|
Treatment Group |
n |
# with Reduction of 3+ Points |
Proportion with Reduction of 3+ Points |
|
New Pain Reliever |
50 |
23 |
0.46 |
|
Standard Pain Reliever |
50 |
11 |
0.22 |