

InterQuartile Range (IQR)
When a data set has outliers or extreme values, we summarize a typical value using the median as opposed to the mean. When a data set has outliers, variability is often summarized by a statistic called the interquartile range, which is the difference between the first and third quartiles. The first quartile, denoted Q1, is the value in the data set that holds 25% of the values below it. The third quartile, denoted Q3, is the value in the data set that holds 25% of the values above it. The quartiles can be determined following the same approach that we used to determine the median, but we now consider each half of the data set separately. The interquartile range is defined as follows:
Interquartile Range = Q3-Q1
With an Even Sample Size:
For the sample (n=10) the median diastolic blood pressure is 71 (50% of the values are above 71, and 50% are below). The quartiles can be determined in the same way we determined the median, except we consider each half of the data set separately.
Figure 9 - Interquartile Range with Even Sample Size
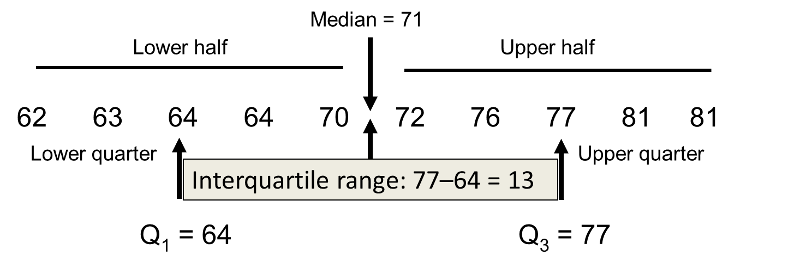
There are 5 values below the median (lower half), the middle value is 64 which is the first quartile. There are 5 values above the median (upper half), the middle value is 77 which is the third quartile. The interquartile range is 77 – 64 = 13; the interquartile range is the range of the middle 50% of the data.
----------------------------------------------------------------------------------------------------------------------------------------------------------------
With an Odd Sample Size:
When the sample size is odd, the median and quartiles are determined in the same way. Suppose in the previous example, the lowest value (62) were excluded, and the sample size was n=9. The median and quartiles are indicated below.
Figure 10 - Interquartile Range with Odd Sample Size
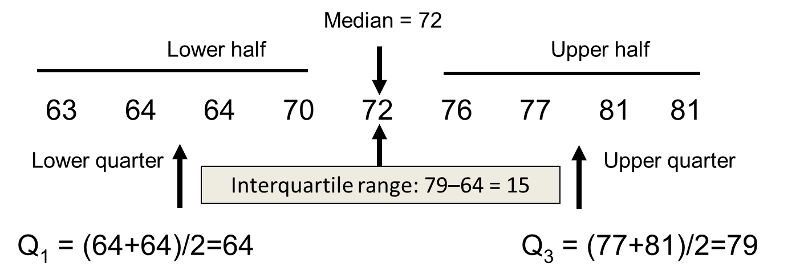
When the sample size is 9, the median is the middle number 72. The quartiles are determined in the same way looking at the lower and upper halves, respectively. There are 4 values in the lower half, the first quartile is the mean of the 2 middle values in the lower half ((64+64)/2=64). The same approach is used in the upper half to determine the third quartile ((77+81)/2=79).
Outliers and Tukey Fences:
When there are no outliers in a sample, the mean and standard deviation are used to summarize a typical value and the variability in the sample, respectively. When there are outliers in a sample, the median and interquartile range are used to summarize a typical value and the variability in the sample, respectively.
|
Tukey Fences There are several methods for determining outliers in a sample. A very popular method is based on the following:
Outliers are values below Q1-1.5(Q3-Q1) or above Q3+1.5(Q3-Q1) or equivalently, values below Q1-1.5 IQR or above Q3+1.5 IQR. These are referred to as Tukey fences.6 For the diastolic blood pressures, the lower limit is 64 - 1.5(77-64) = 44.5 and the upper limit is 77 + 1.5(77-64) = 96.5. The diastolic blood pressures range from 62 to 81. Therefore there are no outliers. The best summary of a typical diastolic blood pressure is the mean (in this case 71.3) and the best summary of variability is given by the standard deviation (s=7.2). |
Table 13 displays the means, standard deviations, medians, quartiles and interquartile ranges for each of the continuous variables in the subsample of n=10 participants who attended the seventh examination of the Framingham Offspring Study.
Table 13 - Summary Statistics on n=10 Participants
|
Characteristic |
Mean |
Standard Deviation |
Median |
Q1 |
Q3 |
IQR |
|---|---|---|---|---|---|---|
|
Systolic Blood Pressure |
121.2 |
11.1 |
122.5 |
113.0 |
127.0 |
14.0 |
|
Diastolic Blood Pressure |
71.3 |
7.2 |
71.0 |
64.0 |
77.0 |
13.0 |
|
Total Serum Cholesterol |
202.3 |
37.7 |
206.5 |
163.0 |
227.0 |
64.0 |
|
Weight |
176.0 |
33.0 |
169.5 |
151.0 |
206.0 |
55.0 |
|
Height |
67.175 |
4.205 |
69.375 |
63.0 |
70.0 |
7.0 |
|
Body Mass Index |
27.26 |
3.10 |
26.60 |
24.9 |
29.6 |
4.7 |
Table 14 displays the observed minimum and maximum values along with the limits to determine outliers using the quartile rule for each of the variables in the subsample of n=10 participants. Are there outliers in any of the variables? Which statistics are most appropriate to summarize the average or typical value and the dispersion?
Table 14 - Limits for Assessing Outliers in Characteristics Measured in the n=10 Participants
|
Characteristic |
Minimum |
Maximum |
Lower Limit1 |
Upper Limit2 |
|---|---|---|---|---|
|
Systolic Blood Pressure |
105 |
141 |
92 |
148 |
|
Diastolic Blood Pressure |
62 |
81 |
44.5 |
96.5 |
|
Total Serum Cholesterol |
150 |
275 |
67 |
323 |
|
Weight |
138 |
235 |
68.5 |
288.5 |
|
Height |
60.75 |
72.00 |
52.5 |
80.5 |
|
Body Mass Index |
22.8 |
31.9 |
17.85 |
36.65 |
1 Determined byQ1-1.5(Q3-Q1)
2 Determined by Q3+1.5(Q3-Q1)
Since there are no suspected outliers in the subsample of n=10 participants, the mean and standard deviation are the most appropriate statistics to summarize average values and dispersion, respectively, of each of these characteristics.
The Full Framingham Cohort
For clarity, we have so far used a very small subset of the Framingham Offspring Cohort to illustrate calculations of summary statistics and determination of outliers. For your interest, Table 15 displays the means, standard deviations, medians, quartiles and interquartile ranges for each of the continuous variable displayed in Table 13 in the full sample (n=3,539) of participants who attended the seventh examination of the Framingham Offspring Study.
Table 15 - Summary Statistics on Sample of (n=3,539) Participants
|
Characteristic |
Mean
|
Standard Deviation (s) |
Median |
Q1 |
Q3 |
IQR |
|
Systolic Blood Pressure |
127.3 |
19.0 |
125.0 |
114.0 |
138.0 |
24.0 |
|
Diastolic Blood Pressure |
74.0 |
9.9 |
74.0 |
67.0 |
80.0 |
13.0 |
|
Total Serum Cholesterol |
200.3 |
36.8 |
198.0 |
175.0 |
223.0 |
48.0 |
|
Weight |
174.4 |
38.7 |
170.0 |
146.0 |
198.0 |
52.0 |
|
Height |
65.957 |
3.749 |
65.750 |
63.000 |
68.750 |
5.75 |
|
Body Mass Index |
28.15 |
5.32 |
27.40 |
24.5 |
30.8 |
6.3 |


Table 16 displays the observed minimum and maximum values along with the limits to determine outliers using the quartile rule for each of the variables in the full sample (n=3,539).
Table 16 - Limits for Assessing Outliers in Characteristics Presented in Table 15
|
|
|
|
Tukey Fences |
|
|
Characteristic |
Minimum |
Maximum |
Lower Limit1 |
Upper Limit2 |
|---|---|---|---|---|
|
Systolic Blood Pressure |
81.0 |
216.0 |
78 |
174 |
|
Diastolic Blood Pressure |
41.0 |
114.0 |
47.5 |
99.5 |
|
Total Serum Cholesterol |
83.0 |
357.0 |
103 |
295 |
|
Weight |
90.0 |
375.0 |
68.0 |
276.0 |
|
Height |
55.00 |
78.75 |
54.4 |
77.4 |
|
Body Mass Index |
15.8 |
64.0 |
15.05 |
40.25 |
1 Determined byQ1-1.5(Q3-Q1)
2 Determined by Q3+1.5(Q3-Q1)

 |
Click below the question to view the answer. |
|
This content requires JavaScript enabled.
|
|