

Confidence Intervals and p-Values
Confidence intervals are calculated from the same equations that generate p-values, so, not surprisingly, there is a relationship between the two, and confidence intervals for measures of association are often used to address the question of "statistical significance" even if a p-value is not calculated. We already noted that one way of stating the null hypothesis is to state that a risk ratio or an odds ratio is 1.0. We also noted that the point estimate is the most likely value, based on the observed data, and the 95% confidence interval quantifies the random error associated with our estimate, and it can also be interpreted as the range within which the true value is likely to lie with 95% confidence. This means that values outside the 95% confidence interval are unlikely to be the true value. Therefore, if the null value (RR=1.0 or OR=1.0) is not contained within the 95% confidence interval, then the probability that the null is the true value is less than 5%. Conversely, if the null is contained within the 95% confidence interval, then the null is one of the values that is consistent with the observed data, so the null hypothesis cannot be rejected.
NOTE: Such a usage is unfortunate in my view because it is essentially using a confidence interval to make an accept/reject decision rather than focusing on it as a measure of precision, and it focuses all attention on one side of a two-sided measure (for example, if the upper and lower limits of a confidence interval are .90 and 2.50, there is just as great a chance that the true result is 2.50 as .90).
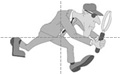
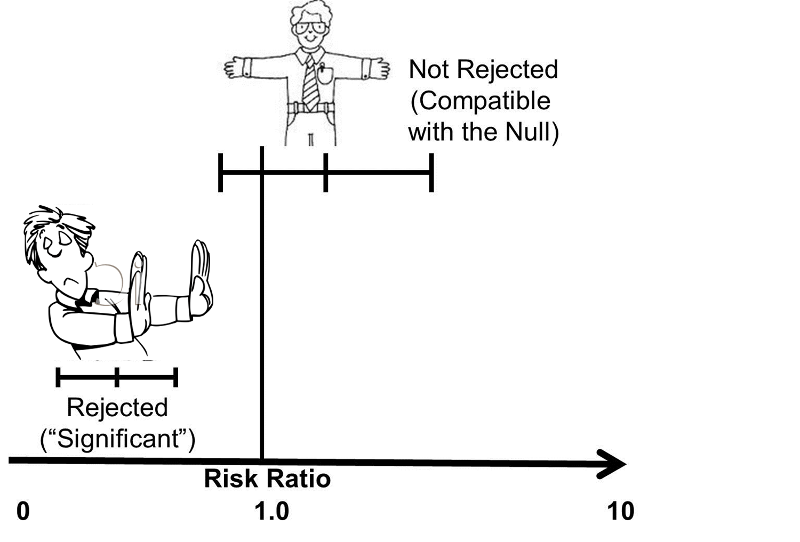
An easy way to remember the relationship between a 95% confidence interval and a p-value of 0.05 is to think of the confidence interval as arms that "embrace" values that are consistent with the data. If the null value is "embraced", then it is certainly not rejected, i.e. the p-value must be greater than 0.05 (not statistically significant) if the null value is within the interval. However, if the 95% CI excludes the null value, then the null hypothesis has been rejected, and the p-value must be < 0.05.
Video Summary: Confidence Intervals for Risk Ratio, Odds Ratio, and Rate Ratio (8:35)
Link to a transcrip of the video
![]()
![]()
The Importance of Precision
With "Non-Significant" Results
The difference between the perspective provided by the confidence interval and significance testing is particularly clear when considering non-significant results. The image below shows two confidence intervals; neither of them is "statistically significant" using the criterion of P< 0.05, because both of them embrace the null (risk ratio = 1.0). However, one should view these two estimates differently. The estimate with the wide confidence interval was likely obtained with a small sample size and a lot of potential for random error. However, even though it is not statistically significant, the point estimate (i.e., the estimated risk ratio or odds ratio) was somewhere around four, raising the possibility of an important effect. In this case one might want to explore this further by repeating the study with a larger sample size. Repeating the study with a larger sample would certainly not guarantee a statistically significant result, but it would provide a more precise estimate. The other estimate that is depicted is also non-significant, but it is a much narrower, i.e., more precise estimate, and we are confident that the true value is likely to be close to the null value. Even if there were a difference between the groups, it is likely to be a very small difference that may have little if any clinical significance. So, in this case, one would not be inclined to repeat the study.
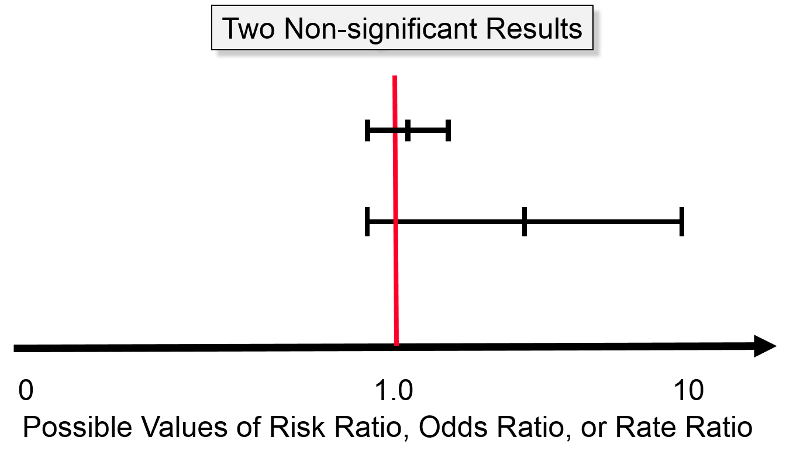
For example, even if a huge study were undertaken that indicated a risk ratio of 1.03 with a 95% confidence interval of 1.02 - 1.04, this would indicate an increase in risk of only 2 - 4%. Even if this were true, it would not be important, and it might very well still be the result of biases or residual confounding. Consequently, the narrow confidence interval provides strong evidence that there is little or no association.
With "Significant" Results
The next figure illustrates two study results that are both statistically significant at P< 0.05, because both confidence intervals lie entirely above the null value (RR or OR = 1). The upper result has a point estimate of about two, and its confidence interval ranges from about 0.5 to 3.0, and the lower result shows a point estimate of about 6 with a confidence interval that ranges from 0.5 to about 12. The narrower, more precise estimate enables us to be confident that there is about a two-fold increase in risk among those who have the exposure of interest. In contrast, the study with the wide confidence interval is "statistically significant," but it leaves us uncertain about the magnitude of the effect. Is the increase in risk relatively modest or is it huge? We just don't know.
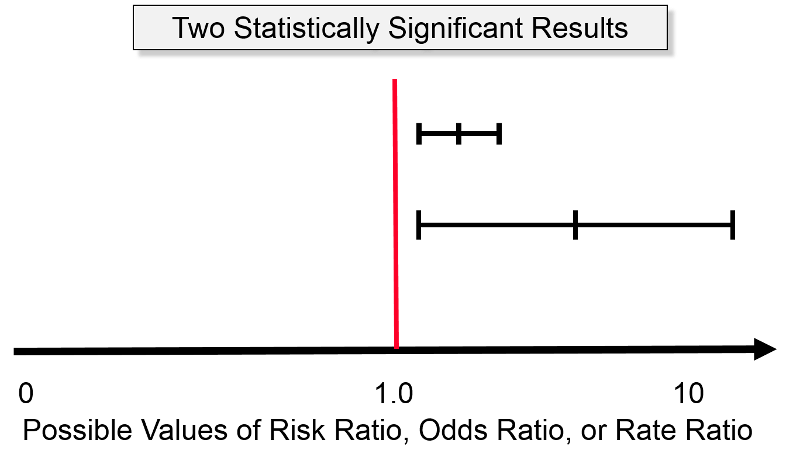
So, regardless of whether a study's results meet the criterion for statistically significance, a more important consideration is the precision of the estimate.

 |
Statistical Significance Using Confidence Intervals. Drag the card from the bottom to the correct category. |
|
This content requires JavaScript enabled.
|
|
