

Multiple Logistic Regression Analysis
Logistic regression analysis is a popular and widely used analysis that is similar to linear regression analysis except that the outcome is dichotomous (e.g., success/failure or yes/no or died/lived). The epidemiology module on Regression Analysis provides a brief explanation of the rationale for logistic regression and how it is an extension of multiple linear regression. In essence (see page 5 of that module). In essence, we examine the odds of an outcome occurring (or not), and by using the natural log of the odds of the outcome as the dependent variable the relationships can be linearized and treated much like multiple linear regression.
Simple logistic regression analysis refers to the regression application with one dichotomous outcome and one independent variable; multiple logistic regression analysis applies when there is a single dichotomous outcome and more than one independent variable. Here again we will present the general concept. Hosmer and Lemeshow provide a very detailed description of logistic regression analysis and its applications.3
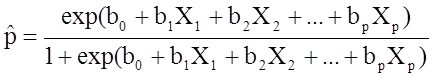
The outcome in logistic regression analysis is often coded as 0 or 1, where 1 indicates that the outcome of interest is present, and 0 indicates that the outcome of interest is absent. If we define p as the probability that the outcome is 1, the multiple logistic regression model can be written as follows:
 ,
,
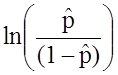
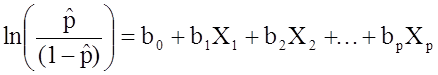
![]() is the expected probability that the outcome is present; X1 through Xp are distinct independent variables; and b0 through bp are the regression coefficients. The multiple logistic regression model is sometimes written differently. In the following form, the outcome is the expected log of the odds that the outcome is present,
is the expected probability that the outcome is present; X1 through Xp are distinct independent variables; and b0 through bp are the regression coefficients. The multiple logistic regression model is sometimes written differently. In the following form, the outcome is the expected log of the odds that the outcome is present,
 :
:
 .
.
Notice that the right hand side of the equation above looks like the multiple linear regression equation. However, the technique for estimating the regression coefficients in a logistic regression model is different from that used to estimate the regression coefficients in a multiple linear regression model. In logistic regression the coefficients derived from the model (e.g., b1) indicate the change in the expected log odds relative to a one unit change in X1, holding all other predictors constant. Therefore, the antilog of an estimated regression coefficient, exp(bi), produces an odds ratio, as illustrated in the example below.
Example of Logistic Regression - Association Between Obesity and CVD
We previously analyzed data from a study designed to assess the association between obesity (defined as BMI > 30) and incident cardiovascular disease. Data were collected from participants who were between the ages of 35 and 65, and free of cardiovascular disease (CVD) at baseline. Each participant was followed for 10 years for the development of cardiovascular disease. A summary of the data can be found on page 2 of this module. The unadjusted or crude relative risk was RR = 1.78, and the unadjusted or crude odds ratio was OR =1.93. We also determined that age was a confounder, and using the Cochran-Mantel-Haenszel method, we estimated an adjusted relative risk of RRCMH =1.44 and an adjusted odds ratio of ORCMH =1.52. We will now use logistic regression analysis to assess the association between obesity and incident cardiovascular disease adjusting for age.
The logistic regression analysis reveals the following:
|
Independent Variable |
Regression Coefficient |
Chi-square |
P-value |
|
Intercept |
-2.367 |
307.38 |
0.0001 |
|
Obesity |
0.658 |
9.87 |
0.0017 |
The simple logistic regression model relates obesity to the log odds of incident CVD:
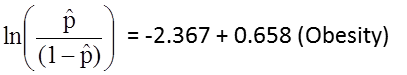
Obesity is an indicator variable in the model, coded as follows: 1=obese and 0=not obese. The log odds of incident CVD is 0.658 times higher in persons who are obese as compared to not obese. If we take the antilog of the regression coefficient, exp(0.658) = 1.93, we get the crude or unadjusted odds ratio. The odds of developing CVD are 1.93 times higher among obese persons as compared to non obese persons. The association between obesity and incident CVD is statistically significant (p=0.0017). Notice that the test statistics to assess the significance of the regression parameters in logistic regression analysis are based on chi-square statistics, as opposed to t statistics as was the case with linear regression analysis. This is because a different estimation technique, called maximum likelihood estimation, is used to estimate the regression parameters (See Hosmer and Lemeshow3 for technical details).
Many statistical computing packages also generate odds ratios as well as 95% confidence intervals for the odds ratios as part of their logistic regression analysis procedure. In this example, the estimate of the odds ratio is 1.93 and the 95% confidence interval is (1.281, 2.913).
When examining the association between obesity and CVD, we previously determined that age was a confounder.The following multiple logistic regression model estimates the association between obesity and incident CVD, adjusting for age. In the model we again consider two age groups (less than 50 years of age and 50 years of age and older). For the analysis, age group is coded as follows: 1=50 years of age and older and 0=less than 50 years of age.
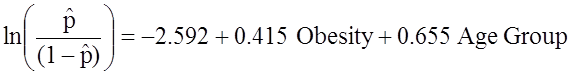
If we take the antilog of the regression coefficient associated with obesity, exp(0.415) = 1.52 we get the odds ratio adjusted for age. The odds of developing CVD are 1.52 times higher among obese persons as compared to non obese persons, adjusting for age. In Section 9.2 we used the Cochran-Mantel-Haenszel method to generate an odds ratio adjusted for age and found
![]()
This illustrates how multiple logistic regression analysis can be used to account for confounding. The models can be extended to account for several confounding variables simultaneously. Multiple logistic regression analysis can also be used to assess confounding and effect modification, and the approaches are identical to those used in multiple linear regression analysis. Multiple logistic regression analysis can also be used to examine the impact of multiple risk factors (as opposed to focusing on a single risk factor) on a dichotomous outcome.
Example - Risk Factors Associated With Low Infant Birth Weight
Suppose that investigators are also concerned with adverse pregnancy outcomes including gestational diabetes, pre-eclampsia (i.e., pregnancy-induced hypertension) and pre-term labor. Recall that the study involved 832 pregnant women who provide demographic and clinical data. In the study sample, 22 (2.7%) women develop pre-eclampsia, 35 (4.2%) develop gestational diabetes and 40 (4.8%) develop pre term labor. Suppose we wish to assess whether there are differences in each of these adverse pregnancy outcomes by race/ethnicity, adjusted for maternal age. Three separate logistic regression analyses were conducted relating each outcome, considered separately, to the 3 dummy or indicators variables reflecting mothers race and mother's age, in years. The results are below.
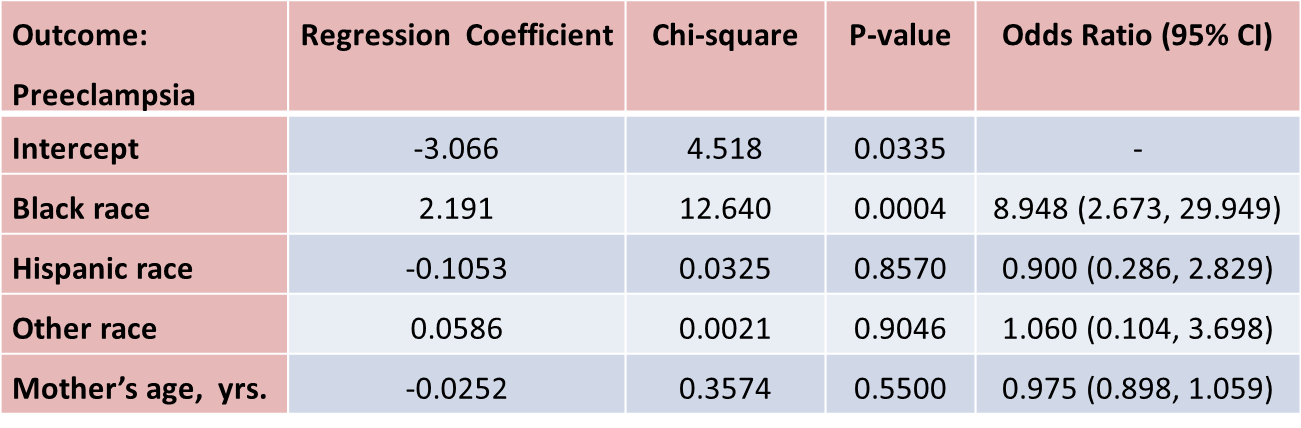
The only statistically significant difference in pre-eclampsia is between black and white mothers.
Black mothers are nearly 9 times more likely to develop pre-eclampsia than white mothers, adjusted for maternal age. The 95% confidence interval for the odds ratio comparing black versus white women who develop pre-eclampsia is very wide (2.673 to 29.949). This is due to the fact that there are a small number of outcome events (only 22 women develop pre-eclampsia in the total sample) and a small number of women of black race in the study. Thus, this association should be interpreted with caution.
While the odds ratio is statistically significant, the confidence interval suggests that the magnitude of the effect could be anywhere from a 2.6-fold increase to a 29.9-fold increase. A larger study is needed to generate a more precise estimate of effect.
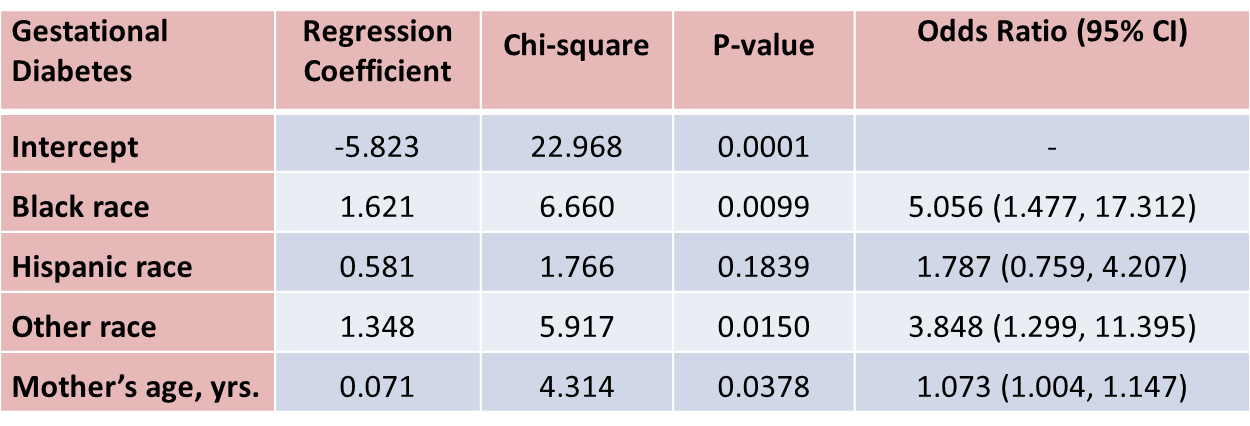
With regard to gestational diabetes, there are statistically significant differences between black and white mothers (p=0.0099) and between mothers who identify themselves as other race as compared to white (p=0.0150), adjusted for mother's age. Mother's age is also statistically significant (p=0.0378), with older women more likely to develop gestational diabetes, adjusted for race/ethnicity.
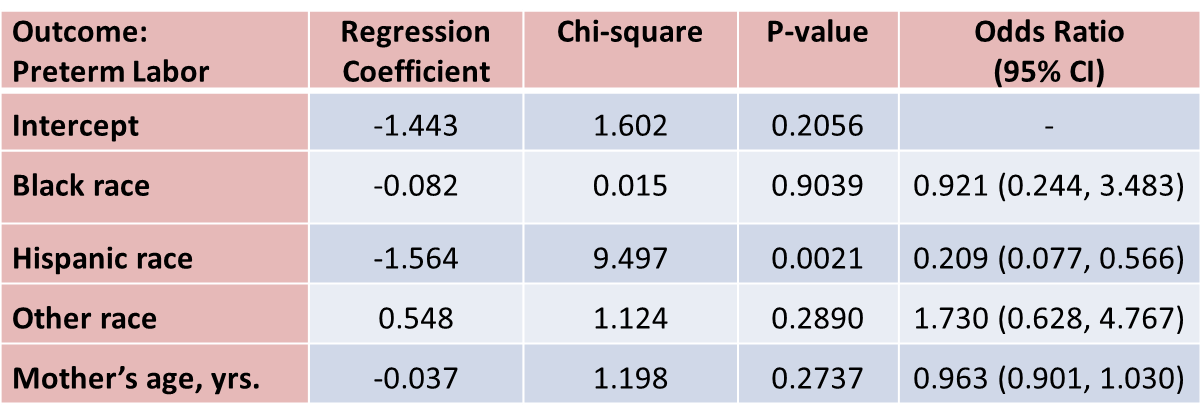
With regard to pre term labor, the only statistically significant difference is between Hispanic and white mothers (p=0.0021). Hispanic mothers are 80% less likely to develop pre term labor than white mothers (odds ratio = 0.209), adjusted for mother's age.