


The Cochran-Mantel-Haenszel Method
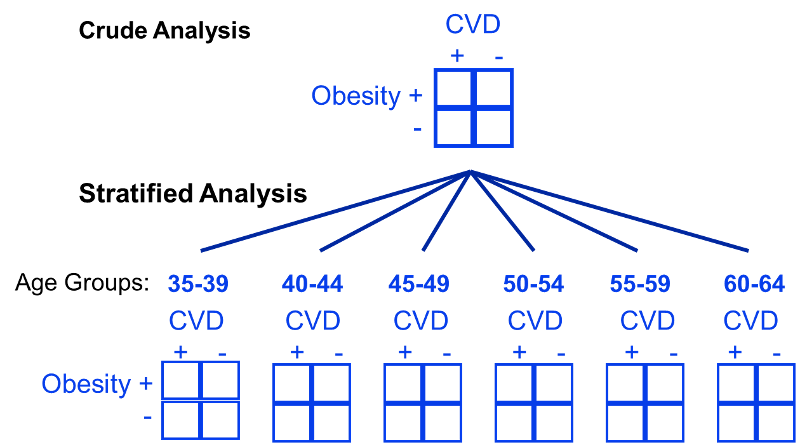
In the example above we saw that the relationship between obesity and CVD was confounded by age. When the data was pooled, it appeared that the risk ratio for the association between obesity and CVD was 1.79. However, when we stratified the analysis into those age <50 and those age 50+, we saw that both groups had a risk ratio of about 1.43. The distortion was due to the fact that obese individuals tended to be older, and older age is a risk factor for CVD. Consequently, in the analysis using the combined data set, the obese group had the added burden of an additional risk factor.
The Cochran-Mantel-Haenszel method is a technique that generates an estimate of an association between an exposure and an outcome after adjusting for or taking into account confounding. The method is used with a dichotomous outcome variable and a dichotomous risk factor. We stratify the data into two or more levels of the confounding factor (as we did in the example above). In essence, we create a series of two-by-two tables showing the association between the risk factor and outcome at two or more levels of the confounding factor, and we then compute a weighted average of the risk ratios or odds ratios across the strata (i.e., across subgroups or levels of the confounder).
Data Layout for Cochran-Mantel-Haenszel Estimates
Before computing a Cochran-Mantel-Haenszel Estimate, it is important to have a standard layout for the two by two tables in each stratum. We will use the general format depicted here:
|
|
Outcome Present |
Outcome Absent |
Total |
|---|---|---|---|
|
Risk Factor Present (Exposed) |
a |
b |
a+b |
|
Risk Factor Absent (Unexposed) |
c |
d |
c+d |
|
|
a+c |
b+d |
n |
Using the notation in this table estimates for a risk ratio or an odds ratio would be computed as follows:
- Risk Ratio:

- Odds Ratio:
Cochran-Mantel-Haenszel Equations
To explore and adjust for confounding, we can use a stratified analysis in which we set up a series of two-by-two tables, one for each stratum (category) of the confounding variable. Having done that, we can compute a weighted average of the estimates of the risk ratios or odds ratios across the strata. The weighted average provides a measure of association that is adjusted for confounding. The weighted averages for risk ratios and odds ratios are computed as follows:
- Cochran-Mantel-Haenszel Estimate for a Risk Ratio
- Cochran-Mantel-Haenszel Estimate for an Odds Ratio
Where ai, bi, ci, and di are the numbers of participants in the cells of the two-by-two table in the ith stratum of the confounding variable, and ni represents the number of participants in the ith stratum.
To illustrate the computations, we can use the previous example examining the association between obesity and CVD, which we stratified into two categories: those with age ‹50 and those who were ≥50 at baseline:
Table of Obesity and Incident Cardiovascular Disease by Age Group
|
|
Age ‹ 50 |
|
|
Age ≥ 50 |
||||
|---|---|---|---|---|---|---|---|---|
|
|
CVD |
No CVD |
Total |
CVD |
No CVD |
Total |
||
|
Obese |
10 |
90 |
100 |
Obese |
36 |
164 |
200 |
|
|
Not Obese |
35 |
465 |
500 |
Not Obese |
25 |
175 |
200 |
|
|
Total |
45 |
555 |
600 |
Total |
61 |
339 |
400 |
|
- Among those ‹50, the risk ratio is:

- Among those ≥ 50, the risk ratio is:
From the stratified data we can also compute the Cochran-Mantel-Haenszel estimate for the risk ratio as follows:
If we chose to, we could also use the same data set to compute a crude odds ratio (crude OR = 1.93) and we could also compute stratum-specific odds ratios as follows:
- Among those ‹50, the risk ratio is:
- Among those ≥ 50, the risk ratio is:
And, using the same data we could also compute the Cochran-Mantel-Haenszel estimate for the odds ratio as follows:
The Cochran-Mantel-Haenszel method produces a single, summary measure of association which provides a weighted average of the risk ratio or odds ratio across the different strata of the confounding factor. Notice that the adjusted relative risk and adjusted odds ratio, 1.44 and 1.52, are not equal to the unadjusted or crude relative risk and odds ratio, 1.78 and 1.93. The adjustment for age produces estimates of the relative risk and odds ratio that are much closer to the stratum-specific estimates (the adjusted estimates are weighted averages of the stratum-specific estimates).
Cochran-Mantel-Haenszel for Incidence Rates
Note that there is also an Cochran-Mantel-Haenszel equation which can be used when dealing with incidence rates in prospective studies in which incidence rates are computed.
The general format is depicted here:
|
|
Outcome Present |
Person-Time |
|---|---|---|
|
Risk Factor Present (Exposed) |
a |
PTe |
|
Risk Factor Absent (Unexposed) |
c |
PT0 |
|
Total |
|
PTT |
Using the notation in this table estimates for an incidence rate ratio would be computed as follows:
Where for each stratum, ai= number of exposed cases, ci=number of unexposed cases, PTei and PT0i are the person-time for exposed and unexposed groups respectively, and PTTi is the total person-time in each stratum.
More Than Two Sub-strata
In the examples above we used just two levels or sub-strata or of the confounding variable, but one can use more than two sub-strata. This is particularly important when using stratification to control for confounding by a continuously distributed variable like age. In the example above looking at the relationship between obesity and CVD we stratified the analysis by age, looking at the relationship in subjects <50 and those who were 50+. However, subjects <50 are likely to vary substantially with respect to BMI and rates of CVD; the same is true for subjects of age 50+. By stratifying into just two broad age groups, we would likely have a problem with residualconfounding. To deal with this, we could stratify by age at 5 year intervals.
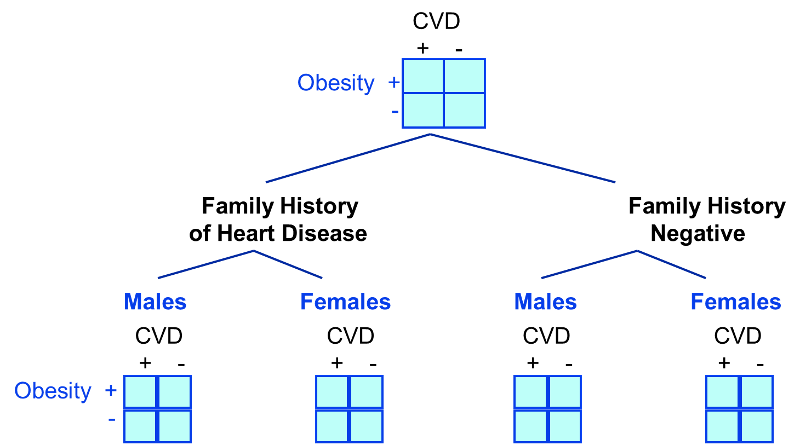
Stratification to Control for Two or More Factors
In looking at the relationship between exercise and heart disease we were also concerned about confounding by other factors, such as gender and the presence of a family history of heart disease. We could also stratify by these factors to see if they were confounders and to adjust for them.
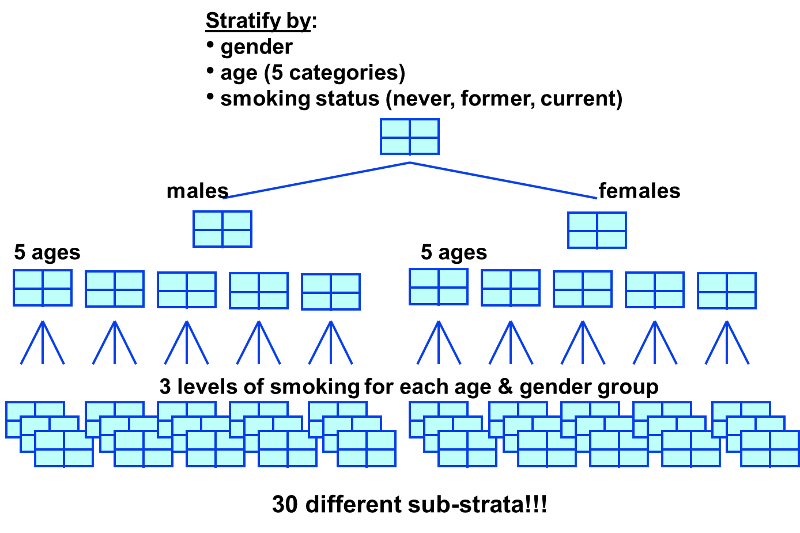
Limitations of Stratified Analysis
A stratified analysis is easy to do and gives you a fairly good picture of what's going on. However, a major disadvantage to stratification is its inability to control simultaneously for multiple confounding variables. For example, you might decide to control for gender, 3 levels of smoking exposure, 4 levels of age, and 4 levels of BMI. This would require 96 separate strata to control for all of these variables simultaneously, and as you increase the number of strata, you keep whittling away at the number of people in each stratum, so sample size becomes a major problem, since many of the strata will contain few or no people.
Summary of Control of Confounding
|
It is possible to minimize confounding by utilizing certain strategies in the design of a study:
There are also analytical techniques that provide a way of adjusting for confounding in the analysis, provided one has information on the status of the confounding factors in the study subjects. These techniques are:
|