Step 4: Conduct Descriptive Epidemiology
Descriptive epidemiology focuses on "person, place, and time", i.e., the personal characteristics of the cases, changes in disease frequency over time, and differences in disease frequency based on location. Characteristics of person, place, and time are the essential elements of for both descriptive epidemiology (to identify possible sources) and for analytic epidemiology (to definitively identify the source).
Collecting and Recording Data: The Line Listing
As cases are identified it is important to record information in a systematic way and to organize it in a way that will make analysis much easier. Traditionally, the data collected during outbreak investigations was recorded on paper in a "line listing", with each case on a separate row and with the items of information in columns. However, it is much easier to record information in an electronic spreadsheet such as Excel, and this will make it much easier to work with the data, since we will show you how to use Excel to sort the data, create an epidemic curve, and compute tallies that will make the descriptive analysis and the analytical analysis a snap. A spreadsheet makes it easy to create a matrix or table which lists information about each case in a row, with columns for each of the variables of interest (e.g., name, gender, age, address, occupation, laboratory findings, relevant exposures, and columns for each of the symptoms that have been included in the case definition, etc.)
What Information Should Be Collected?
Since the investigation will hinge on an analysis of factors related to person, place, and time, the following information should be collected from cases:
- Personal information: Name, address, phone number, age, sex, race, occupation
- Signs and symptoms, as appropriate for the type of outbreak. For example, for hepatitis A one would record the presence or absence of symptoms (fever, nausea, vomiting, anorexia, fatigue) and relevant signs (dark urine, sclera jaundice, etc.). These will be helpful in confirming the diagnosis and determining that the subject meets the case definition.
- Laboratory Test Results
- Relevant Exposures: e.g., for hepatitis A:
- Sources of food (especially ready to eat or uncooked food) and water, including restaurants, cafeterias, etc.
- Raw shellfish consumption
- Recent travel, especially to foreign countries
- Sexual contacts
When interviewing cases, this information might be entered initially onto a case report form or a questionnaire, but it will later be entered into the line listing. The table below shows the first six cases entered into a hypothetical investigation of a hepatitis A outbreak.
| Case # | Initials | Date of Report | Date of Onset | MD Dx | nausea | vomiting | anorexia | fever | dark urine | jaundice | IgM HAV | Age | Sex |
| P1 | TK | 4/6/2004 | 4/2/2004 | Hep A | 0 | 1 | 0 | 1 | 1 | 1 | + | 45 | F |
| P2 | CC | 6/20/2004 | 6/15/2004 | Hep A | 1 | 1 | 1 | 1 | 1 | 1 | + | 57 | M |
| P3 | JD | 7/7/2004 | 7/2/2004 | Hep A | 0 | 1 | 0 | 1 | 1 | 1 | + | 23 | M |
| P4 | PR | 9/5/2004 | 9/1/2004 | Hep A | 1 | 1 | 1 | 1 | 0 | 0 | + | 18 | M |
| P5 | TH | 11/29/2004 | 11/24/2004 | Hep A | 1 | 1 | 0 | 1 | 1 | 1 | + | 56 | F |
| P6 | VH | 12/19/2004 | 12/15/2004 | Hep A | 0 | 1 | 1 | 1 | 1 | 0 | + | 43 | M |
Note that each case is on a separate row, and the variables for each are entered in columns. Note also that the presence or absence of symptoms was indicated using numeric entries with 1 indicating 'yes' and 0 indicating 'no'. The use of numeric data has two great advantages. First, it is unambiguous, whereas alphanumeric entries could be "Y", "y", "YES", "Yes", "yes, "NO", "no", etc. A second major advantage to numeric entries is that they will enable us to take advantage of built in Excel functions that will make analysis of the data exceedingly easy.
Variation Over Time - Epidemic Curves
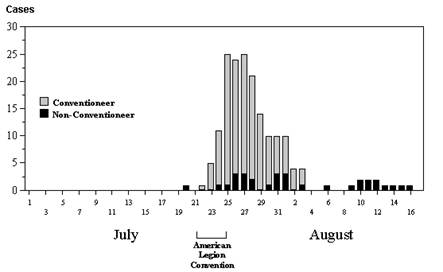 Changes in the frequency of disease over time are best illustrated with an epidemic curve, which shows the number of new cases at intervals over time. The graph to the right is an epidemic curve for the first outbreak of Legionnaires' disease in 1976 in Philadelphia.An epidemic curve provides a great deal of information. If you know what disease you are dealing with and you know its incubation period, the pattern of disease occurrence over time can narrow down the source of infection.
Epidemic Curves
In essence, an epidemic curve is a bar chart with vertical columns that illustrates number of new cases of a specific disease occurring over a span of time. The key information is the time of onset for each of the cases. To construct the epidemic curve one counts up the number of new cases occurring during fixed time intervals (hours, 1 day, 2 days, 4 days, or some other interval.) The interval that is chosen will depend on the length of the time span of interest and the incubation period of the disease being investigated. A brief outbreak of salmonellosis caused by a pot luck luncheon might use 8-hour intervals because of the brevity of the outbreak and the fact that the incubation period for salmonellosis is only 1-3 days. In contrast, an epidemic of hepatitis A caused by an infected food handler at a restaurant might use 1-day or 2 day intervals because hepatitis A has an average incubation period of about 30 days. A useful rule of thumb is to use an interval that allows you to summarize the outbreak with perhaps 10-20 time intervals, as the epidemic curve for Legionnaires' disease illustrates. It is also useful to show the frequency of disease for a period of time before and after the epidemic as well in order to provide perspective.
Constructing an Epidemic Curve in Excel
These videos demonstarte how to construct an epidemic curve using an Excel spreadsheet. The first method is simple, but of limited use with a large sample.
The second method uses pivot tables in Excel and it is better with large samples.
Interpretation of Epidemic Curves
An examination of the shape and duration of the epidemic curve can provide clues about the possible source as illustrated in the table below. However, epidemic curves don't always neatly conform to one of these three patterns.
Point Source Epidemic
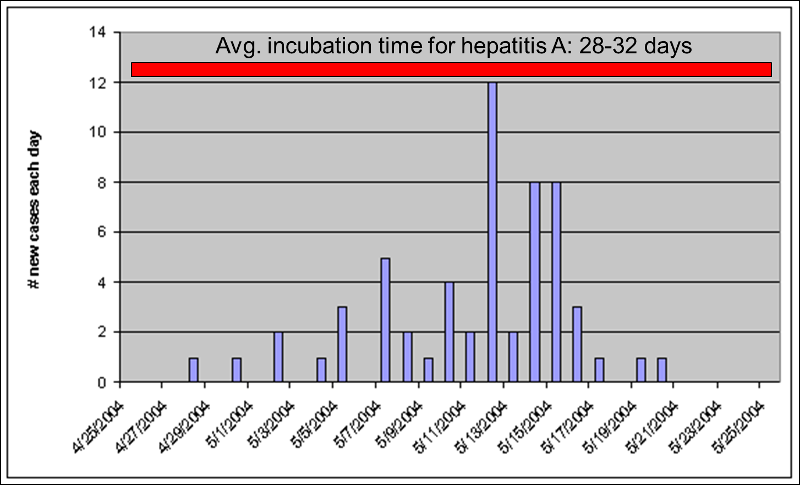
Point source epidemics have a focal source that infects a number of people during a limited period of time. A good example would be a food handler at a restaurant who has a subclinical infection with hepatitis A. The food handler would shed virus for perhaps only a few weeks. In point source epidemics the cases tend to occur during a span of time equal to the average incubation period of the disease. The illustration above shows a point source epidemic of hepatitis A in which all of the cases occur within a one month period consistent with hepatitis A's average incubation period of about 30 days.
Continuous Common Source Epidemic
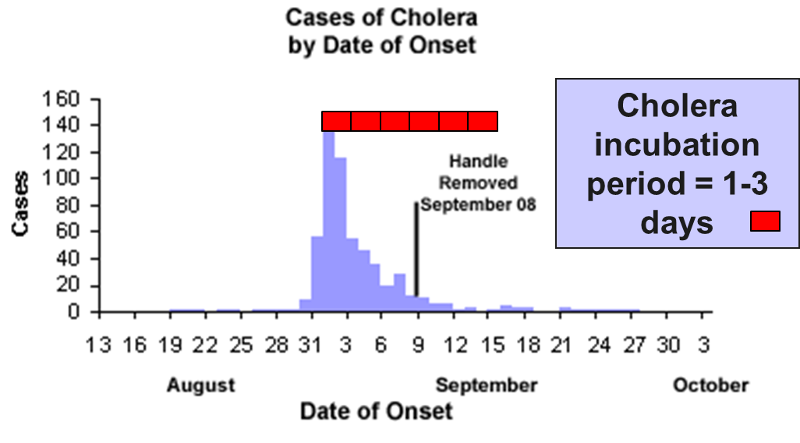
The source is prolonged over an extended period of time and may occur over more than one incubation period. The down slope of the curve may be very sharp if the common source is removed or gradual if the outbreak is allowed to exhaust itself.
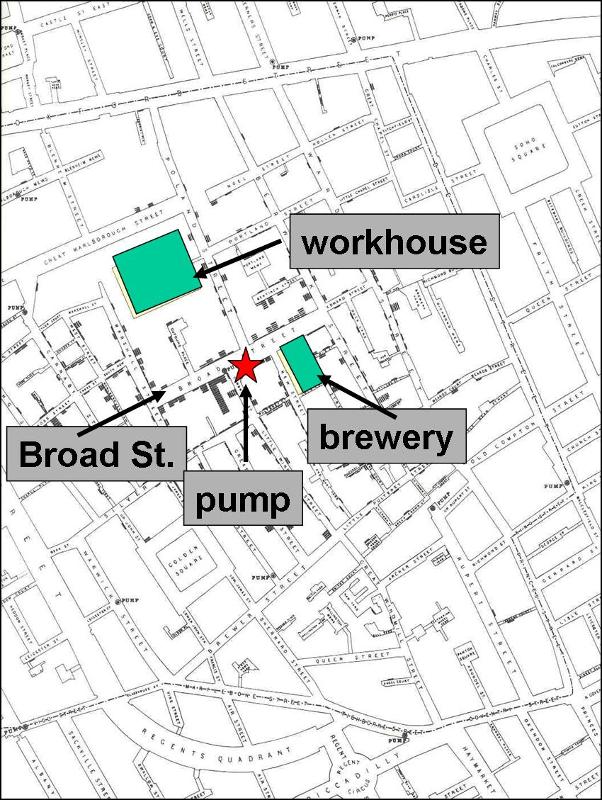
The illustration depicts the outbreak of cholera that occurred in the Broad St. area of London in 1853. The source was a community well that had become contaminated with Vibrio cholerae. Cholera has an incubation period of only 1-3 days. Note however, that the epidemic lasted for more than two weeks. Cases diminished because residents fled the area, but it wasn't terminated until the pump handle was removed.
Propagated Epidemic
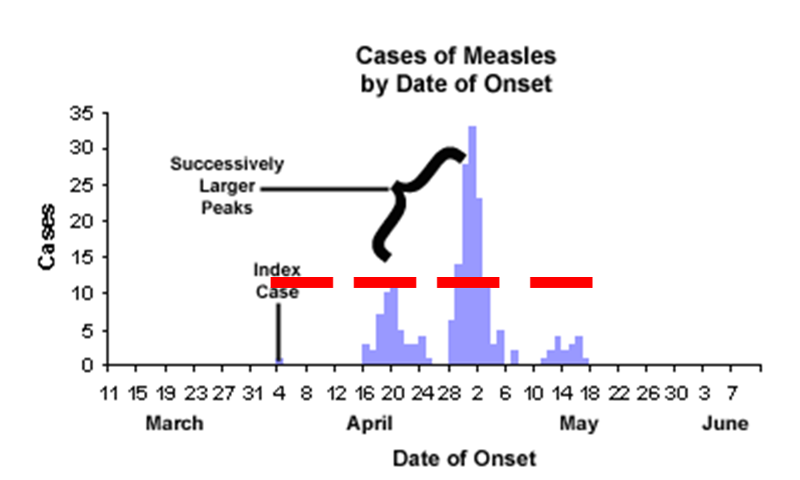
In a propagated epidemic an initial cluster of cases serves as a source of infection for subsequent cases and those subsequent cases, in turn, serve as sources for later cases. This can result in a series of successively larger peaks, reflective of the increasing number of cases caused by person-to-person contact, until the pool of susceptible people is exhausted or control measures are implemented. The figure above shows a measles outbreak in which an index case triggers a cluster of cases, and they, in turn lead to a second cluster of cases, leading finally to a third cluster.
Variation by place
Assessing the location of cases may reveal clusters or patterns that provide clues about the source. It is sometime useful to construct a "spot map" of the place of residence or the workplace of the cases. This may suggest an association with a water supply, a restaurant, or some other food source. In 1854 there was an epidemic of cholera in the Broad Street area of London. John Snow determined the residence or place of business of the victims and plotted them on a street map (the stacked black disks on the map). He noted that the cases were clustered around the Broad Street community pump. It was also noteworthy that there were large numbers of workers in a local workhouse and a brewery, but none of these workers were affected - the workhouse and brewery each had their own well. For a large blow-up of the map, click here.
Variation by Personal Characteristics
Information about the cases is typically recorded in a "line listing," a grid on which information for each case is summarized with a separate column for each variable. Demographic information is always relevant, e.g., age, sex, and address, because they are often the characteristics most strongly related to exposure and to the risk of disease. In the beginning of an investigation a small number of cases will be interviewed to look for some common link. These are referred to as "hypothesis-generating interviews." Depending on the means by which the disease is generally transmitted, the investigator might also want to know about other personal characteristics, such as travel, occupation, leisure activities, use of medications, tobacco, drugs. What did these victims have in common? Where did they do their grocery shopping? What restaurants had they gone to in the past month or so? Had they traveled? Had they been exposed to other people who had been ill? Other characteristics will be more specific to the disease under investigation and the setting of the outbreak. For example, if you were investigating an outbreak of hepatitis B, you should consider the usual high-risk exposures for that infection, such as intravenous drug use, sexual contacts, and health care employment. Of course, with an outbreak of foodborne illness (such as hepatitis A), it would be important to ask many questions about possible food exposures. Where do you generally eat your meals? Do you ever eat at restaurants or obtain foods from sources outside the home? Hypothesis generating interviews may quickly reveal some commonalities that provide clues about the possible sources. It isn't necessary to interview all of the cases, but interviews with half a dozen cases or so may quickly provide important clues about the source. Listen for common exposures.
These links provide useful information about conducting hypothesis-generating interviews:


