

Descriptive Epidemiology for Chronic Diseases
The same questions about person, time, and place can be applied to chronic diseases. Who are the people who have the disease? What are their characteristics? What is their occupation? Where do they live and work? How did disease occurrence vary over time?
Personal Characteristics
Personal characteristics also provide clues about the causes of chronic diseases. Many disease vary in relation to age and gender, but many other characteristics are also important, such as occupation, diet, sexual activity, travel history, and personal behaviors (exercise, smoking, etc.)
Age-specific Rates of Disease
Because so many diseases vary in relation to disease, one frequently sees disease rates categorized this way - so-called "age-specific rates of disease." Mortality rates are very low in the youngest age groups & similar in males and females. In adulthood the mortality rates rise sharply and become higher in males. Although the mortality rate continues to rise into old age, the gender difference begins to narrow. One might describe this as a chronic, progressive disease in which the gender differences raise the question of whether sex hormones play a role, particularly since females begin to catch up after menopause occurs.
Table - Death Rates from Coronary Artery Disease (Age-Specific Rates)
|
Age Group (years) |
Males |
Females |
|---|---|---|
|
5-14 |
0.9 |
0.8 |
|
15-24 |
2.6 |
1.6 |
|
25-34 |
9.4 |
4.2 |
|
35-44 |
60.6 |
16.2 |
|
45-54 |
265.6 |
71.2 |
|
55-64 |
708.7 |
243.7 |
|
65-74 |
1670.0 |
769.4 |
|
75-84 |
3751.5 |
2359.0 |
|
85+ |
8596.0 |
7215.1 |
Differences by Race and Ethnicity
In addition to age and gender one might want to examine how disease rates differ with respect to other characteristics, such as race. The table below summarizes. annual mortality rates per 100,000 in whites and blacks in the United States in 1967. Ethnic and racial differences in disease rates sometimes have a genetic basis, e.g., sickle cell anemia in people of African descent or beta thalassemia in people of Mediterranean descent, but in other cases racial differences are due to environmental or socioeconomic factors.
Table - Annual Mortality Rates per 100,000 population in the US, 1967
|
Cause |
White |
Non-White |
|---|---|---|
|
Homicide |
3.5 |
32.3 |
|
Tuberculosis |
2.5 |
9.6 |
|
Hypertensive heart disease |
21.1 |
68.6 |
|
Diabetes mellitus |
16.6 |
28.9 |
|
Pneumonia |
26.0 |
42.4 |
|
Non-motor vehicle accidents |
28.6 |
43.9 |
|
Motor vehicle accidents |
26.5 |
29.8 |
|
Cirrhosis of liver |
13.2 |
19.9 |
|
Respiratory cancer |
28.9 |
29.8 |
|
Leukemia |
7.4 |
5.5 |
Other Personal Characteristics
Besides age, gender and race/ethnicity, other personal characteristics that might be important to consider are:
- Occupation
- Diet
- Religious practices, e.g. dietary restrictions or restrictions on drinking alcohol or tobacco use
- Leisure activities, e.g., exercise
Place: Variation by Location
Differences in disease frequency by location provides important clues about the determinants of chronic diseases. Where does the disease tend to occur?
- Does the frequency of disease vary from country to country? Or state to state?
- Does it vary among cities or neighborhoods?
- Does it vary within different parts of a large workplace?
Example 1: Stomach Cancer by Location in the US
These maps show death rates from stomach cancer in females (top) and males (below) in different US counties. The darkness of shading of each county indicates how its stomach cancer rate compares with the national average. The darkest shading indicates rates well above average, and white shading indicates rates below average; the gray shading indicates intermediate levels. Note that rates of stomach cancer tend to be high in counties in the north-central part of the country in both males and females. Investigators speculated that these clusters might correlate with populations of German or Scandinavian descent who have a tradition of eating smoked fish. Could the high rates of stomach cancer be the result of their consumption of smoked fish or other traditional methods of food preservation?
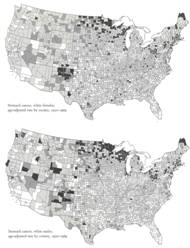
Source: Atlas of Cancer Mortality for U.S. Counties: 1950-1969, TJ Mason et al, PHS, NIH, 1975
Example 2: Differences in Rates of Stomach Cancer in Japan and US
Rates of stomach cancer also vary among countries. Japanese have a higher rate of stomach cancer than Caucasians in California. Is this due to a genetic difference? A dietary difference? The rate among Japanese people diminishes after they move to US, and diminishes even more in their offspring. One possibility is that once the Japanese move here, they begin to shift to an American diet, and this trend is even stronger in their children. Are there important dietary differences? Could consumption of large amounts of smoked fish be a cause of stomach cancer?
|
Population |
Mortality Rate (per 100,000 population) |
|---|---|
|
Japanese in Japan |
58.4 |
|
Japanese immigrants to California |
29.9 |
|
Sons of Japanese immigrants |
11.7 |
|
Native Californians (Caucasians) |
8.0 |
Variation in Disease Over Time
- Has the frequency of disease changed over several decades?
- Does frequency of disease vary in a cyclic way that relates to the seasons?
- Has it changed over the course of days?
Changes in disease rate over time can also provide clues for chronic diseases.
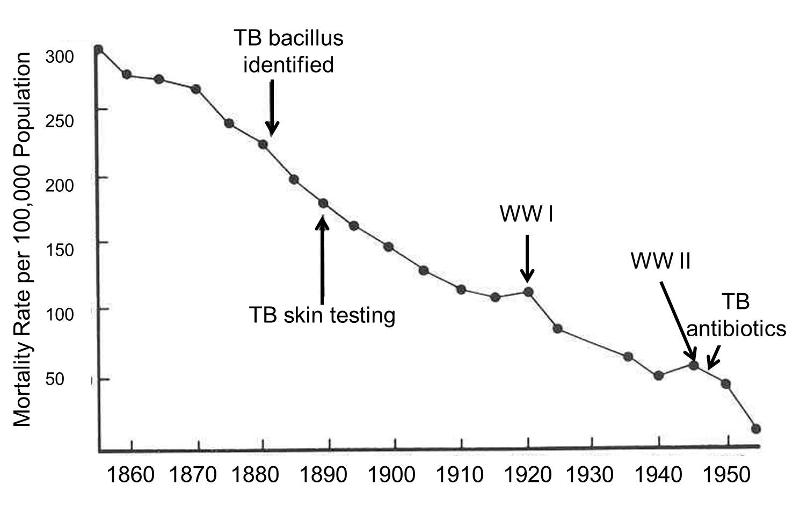
Example 1: Annual Mortality from Pulmonary Tuberculosis in England and Wales
Tuberculosis (TB) is one of the great killers of all times. The graph on the right shows the mortality rate from TB from 1855-1955 in England and Wales. The remarkable downward trend began well before the development of antibiotics. The steady improvement was probably a direct result of "the sanitary idea" which resulted in concerted efforts to improve working and living conditions, nutrition, ventilation, and waste management. Also, note the increases in TB mortality that occurred during World War I and World War II. This suggests that nutritional deficiencies, translocation, crowding, and other adverse circumstances associated with war are contributing factors to the causation of TB.
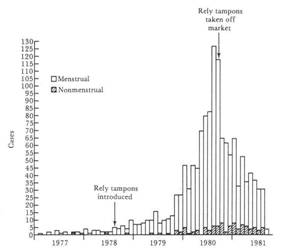
Example 2: Toxic Shock and Rely Tampons
In January 1980 there were several reports of toxic shock syndrome due to infection with Staphylococcus aureus bacteria, and the descriptive epidemiology indicated that the problem was occurring primarily in menstruating women. A CDC task force investigated and eventually traced the outbreak to the introduction of Rely tampons, a super absorbent product marketed by Proctor and Gamble. The monthly cases of toxic shock syndrome in 1980-1981 are shown in the graph below [from A. Reingold et al., Toxic shock syndrome surveillance in the United States, 1980-1981. Ann. Intern. Med 96:875, 1982]. The graph shows that prior to 1978 there were just occasional cases of toxic shock syndrome in the United States. After Rely tampons were introduced in 1978, there was a steady increase in toxic shock cases which peaked at about 125 per month in 1980. Shortly after that, Rely tampons were taken off the market, and the incidence declined sharply.
There were actual two pieces of evidence related to time variations that supported Rely tampons as the cause. First, descriptive epidemiology suggested a link to menstruation, leading doctors to take bacterial cultures from the vagina. This provided a key clue suggesting a link to certain brands of tampons. In addition, the frequency of toxic shock syndrome clearly correlated with the introduction and subsequent removal of Rely tampons from the market.
Other Factors That Can Produce Changes in Disease Frequency Over Years or Decades
If the frequency of a disease or mortality from a disease changes over time, there are several factors which could be responsible:
- Changes in incidence due to environmental or life-style changes.
- Improvements in diagnosis may increase cases reported even though the incidence may not be changing.
- Changes in record keeping (accuracy) can create what appear to be changes in disease rates.
- Improved treatment may decrease mortality rates
- Changes in the age distribution of a population can produce changes in the overall rate of disease, even though age-specific rates are not changing.
