


Selection of Subjects
General Population Cohorts versus Special Exposure Cohorts
For common risk factors, (e.g., smoking, obesity) investigators may enroll a general population cohort, e.g.,
- The general population (e.g., the Framingham Heart Study) or
- A particular subset of the general population,, e.g., nurses or doctors, because they provide reliable information & they are easier to follow-up.
Once a general population cohort is enrolled, investigators will ascertain their baseline exposures to a large number of exposures of interest and possible confounding factors that they may need to adjust for in the analyses.
For uncommon risks, investigators use special exposure cohorts, e.g.,
- Soldiers exposed to dioxin (agent orange) in Vietnam
- Survivors of the bombing of Hiroshima and Nagasaki
- Residents of the Love Canal area of Niagara, NY who were exposed to chemical wastes
The Comparison Group
The ideal comparison group in a cohort study would be a group that was exactly the same as the exposed group, except that they would be unexposed. This is referred to as the "counterfactual ideal, " because it is impossible for the same person to be both exposed and unexposed at the same time. Consequently, the best one can do is to select a comparison group that differs with respect to the exposure of interest but is a similar as possible with respect to other factors that might influence the outcome. There are two key things that are essential in selecting the comparison group in a cohort study:
- The unexposed (or less exposed) comparison group should be as similar as possible with respect to other factors that could influence the outcome being studied (possible confounding factors).
- Information collection should be as accurate & as comparable as possible in all groups in order to avoid biasing the association.
There are three general types of comparison groups for cohort studies.
- An internal comparison group
- A comparison cohort
- The general population
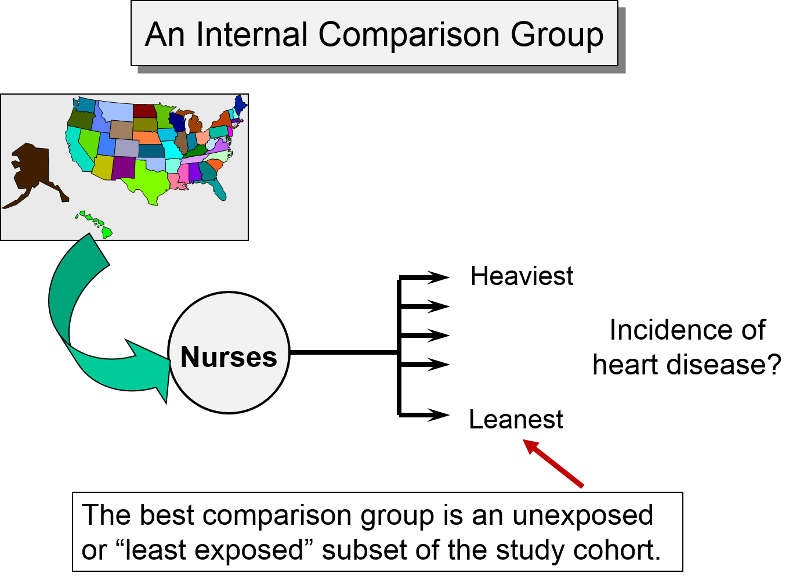
Internal Comparison Group
An internal comparison group consists of unexposed members of the same cohort. This is generally the best comparison group, because the subjects are comparable in many respects. For example, as noted earlier, the Nurses' Health Study, used the cohort to study a possible association between obesity and myocardial infarction. Subjects from the cohort were categorized into one of five levels of body mass index, and the group with the lowest BMI was used as an internal comparison group or reference group, against which the other categories were compared.
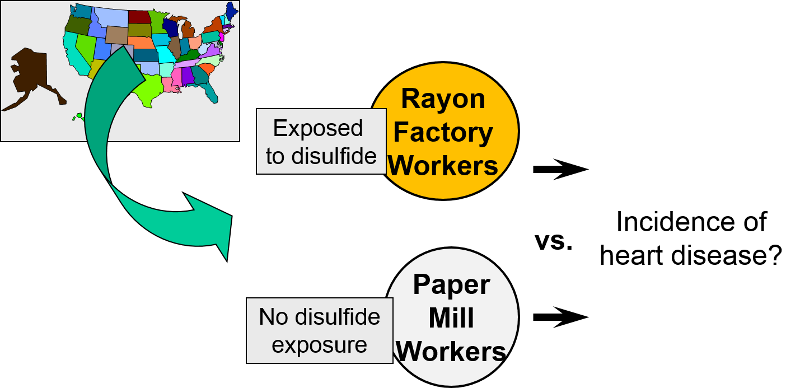
External Comparison Group
When it isn't possible to take a well-defined cohort and divide it into exposure groups, sometimes one can identify an external comparison cohort. This type of comparison group was used when researchers wanted to look at occupational exposure to disulfide in rayon factory workers. Because virtually all workers in the plant were exposed to disulfide, it was not possible to use an internal comparison group from the same plant. Instead, they selected a group of people employed in a paper mill as an external comparison cohort. Both groups had similar education, age, socioeconomic status, and gender distribution. However, they may have differed with respect to other important confounding factors.
General Population as a Comparison Group
The third possibility is to use the general population as a comparison group. This is used occasionally in situations where only a small percentage of the population is exposed, e.g., with an unusual occupational exposure. However, the general population may differ from the exposed work force in many ways, including overal health.
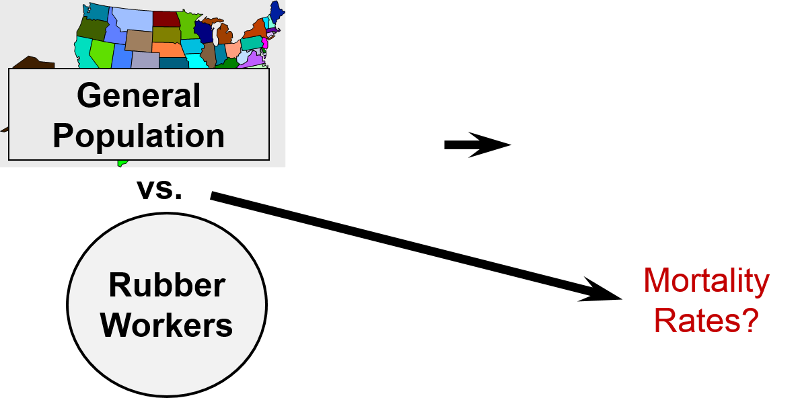
One study looked at mortality rates of workers in the rubber industry and compared them to the general population of the US. There are several problems with this. 1) Some of the general population will have had the exposure (same occupation); 2) the general population includes people who are unable to work because of illness or disability. Employed workers tend to be healthier than the general population. This is a well-documented phenomenon know as the "healthy worker effect." Rates of disease and death tend to be higher in the general population than in the employed work force because the general population includes many people who are too sick or disabled to work. As a result, even if the exposure was, in fact, associated with higher mortality, the magnitude of association would be underestimated because of the inherently higher mortality rate in the general population (which includes both employed and unemployed workers). Although this is not a problem with all diseases, the general population generally exhibits the greatest departure from the counterfactual ideal, and therefore is less widely used today than in the past. Another notable disadvantage of the general population comparison group is that data on important confounders are almost never available.
The use of the general population as a comparison group is most likely to be seen today in descriptive epidemiology, particularly when there are many categories of exposure with only a small number of outcomes per category. For example, the Massachusetts Cancer Registry reports the cancer rate in each of 351 cities and towns using the overall rate in the general population as a comparison. Similarly, descriptions of occupational mortality based on death certificate data may have hundreds of different occupations and also use the general population as a comparison group.
Studies of this type sometimes use a standardized mortality ratio (SMR) as the measure of association. Data from the general population provide overall rates of mortality in the population. These rates are then used to predict how many deaths would be expected in the cohort under study. The SMR is the ratio of observed deaths in the cohort to the number of deaths expected. The SMR is interpreted much like a risk ratio. For example, an SMR=1.2 indicates 1.2 times the risk in the general population or a 20% increase in risk. (Note that sometimes the SMR is multiplied x 100; if so, SMR=120 would also indicate a 20% increase in risk. If population rates are available by age, gender, and race, then SMRs can be adjusted or "standardized" to control for confounding by these factors. This is a method sometimes referred to as "indirect standardization."
A similar analytical approach is used to compute standardized incidence ratios (SIR). For example, the Massachusetts Cancer Registry uses the general population of Massachusetts as a comparison group in order to examine whether the incidence of specific cancers differs in individual communities compared to the entire state's incidence. In this setting the measure of association that is used is a standardized incidence ratio (SIR). SIRs can also be interpreted much like a risk ratio, although they are typically multiplied by 100, so that SIR=120 would indicate an incidence that was 20% greater than that in the overall population.
Link to the Massachusetts Cancer Registry
Link to BUSPH learning module on Standardized Rates and page on Standardized Incidence Ratios