The Population Attributable Fraction
(Also called the Population Attributable Proportion or Attributable Proportion Among the Total Population)
One can also compute the proportion or percentage of cases in the entire study population that can be attributed to the exposure. In the problem above we computed the attributable fraction for the exposed group, but what is the attributable fraction for the entire population?
Consider the example on the previous page, which is summarized by this table:
|
Exposure Status |
Diseased |
No Disease |
Population |
|
Cumulative Incidence (Risk) |
|---|---|---|---|---|---|
|
Exposed |
500 |
9,500 |
10,000 |
|
0.050 |
|
Not Exposed |
900 |
89,100 |
90,000 |
|
0.010 |
|
Column Totals |
1,400 |
98,600 |
100,000 |
|
0.014 |
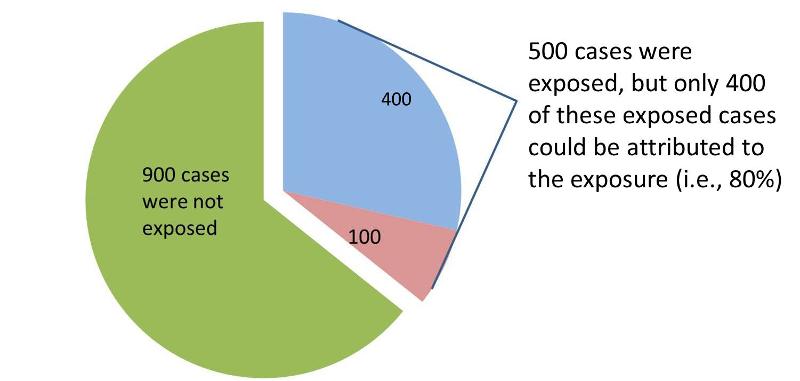
The attributable proportion for the entire population is the (incidence) risk in the overall population that can be attributed to the exposure. In the table above there are 1,400 total cases in the "Diseased" column, but only 500 of these had the exposure of interest. None of the other 900 cases can be attributed to the exposure, because they were not exposed. Consequently, only 500/1,400 = 0.357, or 35.7% of the diseased subjects were exposed (35.7% is the proportion of exposed cases).
However, not all of these diseased cases can be attributed to the exposure.We know from our previous calculation of the attributable fraction in the exposed group that the attributable fraction for the exposed group was 0.8, or 80%. Therefore, for the entire population, the fraction of cases that can be attributed to the exposure is 0.357 x 0.80 = 0.286, or 28.6%.

Interpretation:
28.6% of all cases in the population are attributable to the exposure.
Another way to look at this is to look at the pie chart above and consider that only 400 of the exposed cases could be attributed to the exposure, but in the population there were a total of 1,400 cases. So, 400/1400 = 28.6%, the proportion of all cases in the population that could be attributed to the exposure.
This calculation can be summarized as follows:
Population Attributable Fraction (PAF) = (proportion of cases exposed) x (attributable proportion in the exposed)
This is the proportion (fraction) of all cases in the population that can be attributed to the exposure.
Another equivalent method that can be useful is the following:


where Ppop = the proportion of exposed subjects in the entire study population, and RR = the risk or rate ratio. This formulation can be especially helpful if you have an estimate of the proportion of exposed subjects in a population from an external source, such as a population survey. For example, if we know that the relative risk for the effect of smoking on lung cancer is approximately 20, and our surveillance system data tell us that 20% of the adult population of the U.S. smokes, we can calculate the proportion of all lung cancer cases in the population that are attributable to smoking:


Interpretation:
79% of all cases of lung cancer in the U.S. are attributable to smoking.


