


Stratified Analysis
Stratified Analysis of a Cohort Study
The easiest way to do a stratified analysis with a cohort study or a clinical trial is to subset the data into substrata and compute the risk ratio within each of the substrata.
In the large data set from the Framingham Heart Study there are the following variables:
- hospmi - whether the subject was hospitalized for a myocardial infarction (heart attack), coded 1= yes, 0=no
- diabetes - whether the subject had type 2 diabetes, coded 1= yes, 0=no
- male - whether the subject was male or female, code 1=male, 0=female
My goal is to compute the risk ratio for the association between diabetes and hospmi stratified by sex. I begin by subsetting the data into males and females
fram<-FHSDataSet
attach(fram)
# First run crude analysis
table(diabetes,hospmi)
riskratio.wald(diabetes,hospmi)
# Then subset and compute stratified risk ratios
females<-subset(fram, male==0)
males<-subset(fram, male==1)
# Make sure the epitools package is installed and loaded
library(epitools)
# Use riskratio.wald() to compute the stratum-specific risk ratios
riskratio.wald(females$diabetes,fram_females$hospmi)
riskratio.wald(males$diabetes,male$hospmi)
Output:
> # First run crude analysis
> table(diabetes,hospmi)
*****************hospmi
diabetes ***0 **1
***********0 2557 210
***********1 *183 **48
> riskratio.wald(table(diabetes,hospmi))
$data
**************hospmi
diabetes
*******************0 **1 Total
***********0 2557 210 *2767
***********1 *183 **48 **231
****Total 2740 258 *2998
$measure risk ratio with 95% C.I.
diabetes
**estimate ***lower **upper
0 1.00000 ******NA *****NA
1 2.73791 2.062282 3.63488
$p.value
two-sided
diabetes **midp.exact fisher.exact *chi.square
***********0 **********NA **********NA ***** ****NA
***********1 1.945462e-09 1.88176e-09 6.548224e-12
$correction
[1] FALSE
attr(,"method")
[1] "Unconditional MLE & normal approximation (Wald) CI"
# Stratified
> females<-subset(fram, male==0)
> males<-subset(fram, male==1)
> # Make sure the epitools package is installed and loaded
> library(epitools)
# FEMALES
> riskratio.wald(females$diabetes,females$hospmi)
$data
*****************Outcome
Predictor ***0 *1 Total
************0 1536 63 *1599
************1 *100 19 **119
*****Total 1636 82 *1718
$measure
risk ratio with 95% C.I.
Predictor estimate ***lower **upper
************0 1.000000 ******NA ******NA
************1 *4.052421 2.512617 6.53586
$p.value
two-sided
Predictor **midp.exact fisher.exact *chi.square
************0 **********NA ***********NA ***********NA
************1 1.362668e-06 1.134288e-06 2.907645e-09
$correction
[1] FALSE
attr(,"method")
[1] "Unconditional MLE & normal approximation (Wald) CI"
#MALES
> riskratio.wald(males$diabetes,males$hospmi)
$data
*******************OoOutcome
Predictor ***0 ***1 Total
************0 1021 147 **1168
************1 **83 **29 ***112
*****Total 1104 176 **1280
$measure
risk ratio with 95% C.I.
Predictor estimate lower upper
0 1.000000 *****NA *******NA
1 2.057337 1.452882 2.913269
$p.value
two-sided
Predictor **midp.exact fisher.exact chi.square
************0 **********NA ***********NA ********NA
************1 0.0003344017 0.0002819976 9.3661e-05
$correction
[1] FALSE
attr(,"method")
[1] "Unconditional MLE & normal approximation (Wald) CI"
Summary:
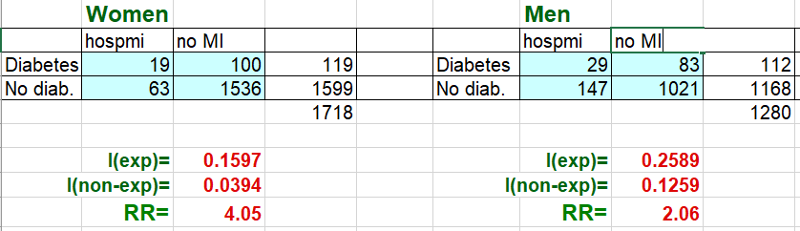
- The crude risk ratio for the association between diabetes and being hospitalized for a myocardial infarction was RR=2.74.
- The RR =4.05 in females and RR=2.05 in males.
- The Mantel-Haenszel risk ratio =2.56 (calculations not shown).
Magnitude of confounding = (crude RR- adjusted RR) / (adjusted RR) = (2.74-2.56) / 2.56 = 0.07 =7%. Since this is less than 10%, there was little evidence of confounding. However, the risk ratio in females was nearly twice that in males, so there was evidence of possible effect measure modification.'
Stratified Analysis of a Case-Control Study
Calculating a Mantel-Haenszel Pooled Estimate of Odds Ratio with the epiDisplay package
You can do a stratified analysis of a case-control study using another imported package call "epiDisplay", but the package has to be installed once, and then it has to be loaded each time you want to use it.
To install it, go to the lower right windon in R Studio and click on the "install" tab.

Another window opens. Enter "epiDisplay" as shown below.
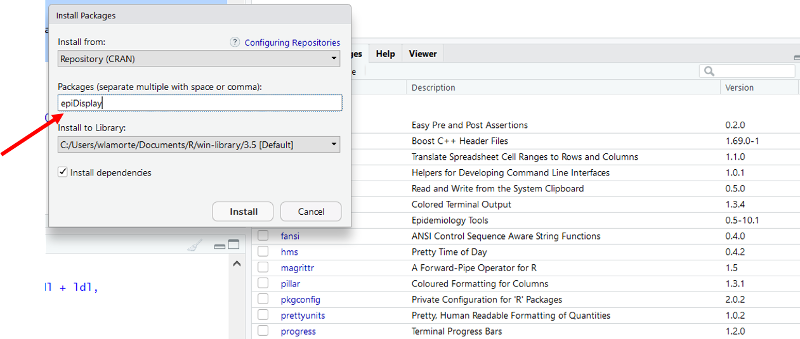
Click on "Install at the bottom of the window. The package should be installed, and you should see the following text appear in the Console window.
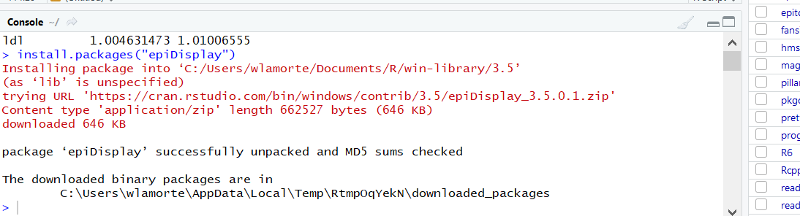
The installation procedure above only needs to be done once, but you need to load the package each time you use it by including the following line of code in your script:
library(epiDisplay)
> # Stratified with epiDisplay
> library(epiDisplay)
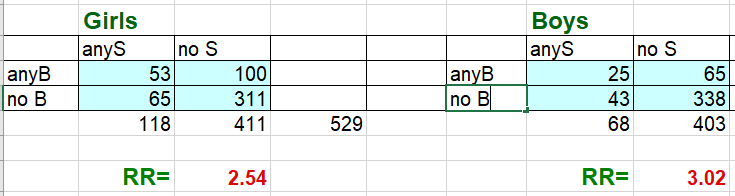
> mhor(anyB,anyS,female)
Stratified analysis by female
OR lower lim. upper lim. P value
female 0 3.01 1.64 5.46 1.86e-04
female 1 2.53 1.61 3.97 2.84e-05
M-H combined 2.69 1.92 3.79 5.02e-09
M-H Chi2(1) = 34.18 , P value = 0
Homogeneity test, chi-squared 1 d.f. = 0.24 , P value = 0.627
Interpretation: The crude odds ratio for the assocation between anyB and anyS was 2.84. After adjusting for confounding by sex, the Mantel-Haenszel odds ratio was 2.69 (p<0.0001). The magnitude of confounding was (crude OR- adjusted OR) / adjusted OR = (2.84-2.69) / 2.69 = 0.056 = 5.6%. THis is less than a 10% difference, so there was little or no confounding by sex.