

Interpreting the Y-Intercept and the Slope
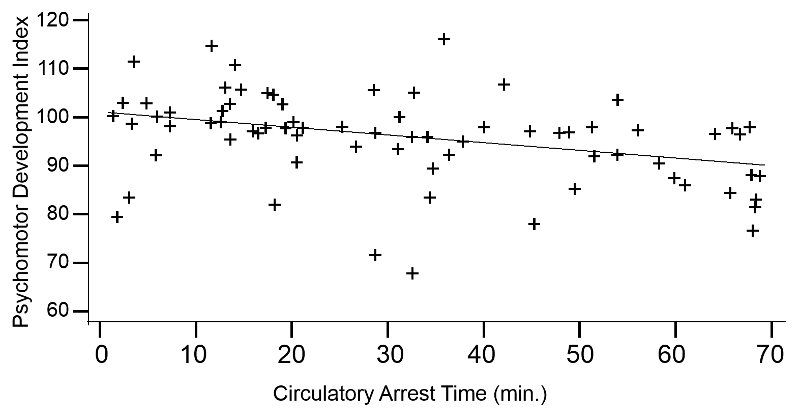
Open heart surgery requiring temporary cardiac arrest with support from a cardiopulmonary bypass pump has been associated with temporary or permanent cognitive decline in adults. Investigators wanted to determine if newborn infants undergoing cardiac surgery on a bypass pump had delays in psychomotor development at one year of age. Psychomotor development was assessed with a standardized index in 155 children at one year of age. The graph below shows some of their results.
Adapted from Bellinger et.al., N Engl J Med. 1995 Mar 2;332(9):549-55.
The simple linear regression equation for these observations was as follows:
Psychomotor Development Index = 101.25 – 0.164 (circ. arrest time)
with R2=0.138, p=0.002
The developmental index that was used had a mean of 100 in normal one year old children. The Y-intercept from the regression is 101.25, so in this case the Y-intercept makes sense. Be aware, however, that the Y-intercept is frequently not interpretable; it only makes sense when it corresponds to a logical "basal" value.
The slope from the regression line is -0.164, suggesting that for each minute the infant is on the bypass pump, there is an associated decrease of 0.164 units in the psychomotor development score one year later. So, the regression line begins at 101.25 at 0 minutes and declines to a score of about 90 after 70 minutes on the bypass pump.
The individual data points are scattered about the regression line, but the association is statistically significant, with p=0.002. The R2=0.138, suggesting that about 13.8% of the variability in psychomotor development score can be attributed to differences in time on the bypass pump.
 Test Yourself
Data from the Framingham Heart Study was used to test the association between age (AGE) and systolic blood pressure (SYSBP). The following analysis was conducted:
> reg.out<-lm(SYSBP~AGE)
> summary(reg.out)
Call:
lm(formula = SYSBP ~ AGE)
Residuals:
Min 1Q Median 3Q Max
-57.52 -13.82 -2.35 10.02 148.30
Coefficients:
Estimate Std. Error t value Pr(>|t|)
(Intercept) 86.1165 5.6213 15.32 <2e-16 ***
AGE 0.9466 0.1112 8.51 <2e-16 ***
---
Signif. codes: 0 '***' 0.001 '**' 0.01 '*' 0.05 '.' 0.1 ' ' 1
Residual standard error: 21.02 on 498 degrees of freedom
Multiple R-squared: 0.127, Adjusted R-squared: 0.1252
F-statistic: 72.43 on 1 and 498 DF, p-value: < 2.2e-16
- What would be the predicted systolic blood pressure for a 60 year old man?
- Interpret in words the Multiple R-squared: 0.127.
