


Performing Simple Linear Regression With R
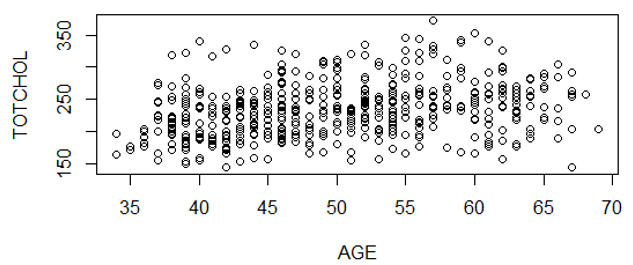
In an earlier example, we created a scatter plot of AGE and TOTCHOL (total cholesterol) in a subset of data from the Framingham study.
> cor(AGE,TOTCHOL)
[1] 0.2917043
We can perform a linear regression analysis with the same data:
# The first step asks for a linear regression ("lm" means linear model) and puts the output in an object we called "reg.out"
> reg.out<-lm(TOTCHOL~AGE)
> summary(reg.out)
Call:
lm(formula = TOTCHOL ~ AGE)
Residuals:
Min 1Q Median 3Q Max
-114.618 -28.453 -2.034 21.885 127.889
Coefficients:
Estimate Std. Error t value Pr(>|t|)
(1ntercept) 161.4220 10.7726 14.985 < 2e-16 ***
AGE 1.4507 0.2132 6.806 2.9e-11 ***
---
Signif. codes: 0 '***' 0.001 '**' 0.01 '*' 0.05 '.' 0.1 ' ' 1
Residual standard error: 40.28 on 498 degrees of freedom
Multiple R-squared: 0.08509, Adjusted R-squared: 0.08325
F-statistic: 46.32 on 1 and 498 DF, p-value: 2.9e-11
Interpreting the Output from Linear Regression in R
-
Under "Coefficients", the column labeled "Estimate" provides the Y-intercept value and the coefficient for the independent variable AGE. From these we can construct the equation for the regression line
TOTCHOL=1.4507(AGE)
- The p-value (Pr column) is 2.9x10⁻¹¹, and the three asterisks indicate that the association is statistically significant at p<0.001. This p-value is the same as the p-value for the correlation coefficient that we got earlier, as shown below.
> cor.test(AGE,TOTCHOL) Pearson's product-moment correlation data: AGE and TOTCHOL t = 6.8056, df = 498, p-value = 2.9e-11 alternative hypothesis: true correlation is not equal to 0 95 percent confidence interval: 0.2093693 0.3699321 sample estimates: cor 0.2917043
- The second line from the bottom of the regression output indicates “Multiple R-squared: 0.08509â€. This R2 is called the coefficient of determination:, which is the percent variation in Y (TOTCHOL) explained by differences in X (AGE). Here only 8.5% of the variability in TOTCHOL is explained by differences in AGE, despite the fact that the association is highly statistically significant. Therefore, increasing age is associated with increases in cholesterol, but there must be other factors that account for differences in cholesterol as well. Also note that for a regression model with just one predictor variable, as we have here (AGE), R2 is equal to the square of the correlation coefficient (r), as shown below.
> 0.2917043^2
[1] 0.0850914
[The Adjusted R2 accounts for the number of predictors in the model. The adjusted R2 increases only if an additional variable improves fit more than would be expected by chance, R2adj < R2 . You can ignore this and just use the Multiple R2.]