


Simple Linear Regression
In an earlier example we considered accumulated savings over time.
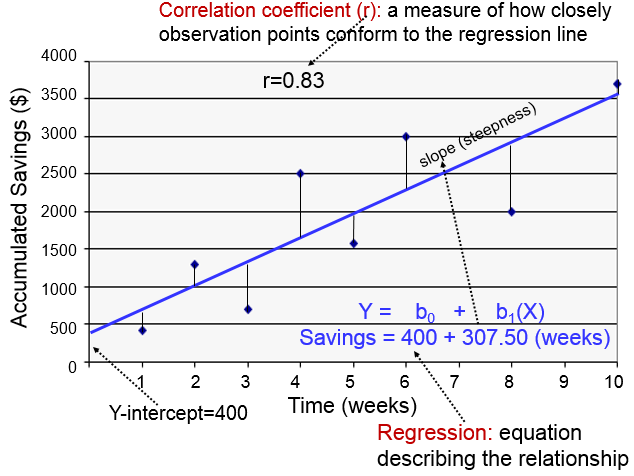
The correlation coefficient indicates how closely these observations conform to a linear equation. The slope (b1) is the steepness of the regression line, indicating the average or expected change in Y for each unit change in X. In the illustration above the slope is 307.5, so the average savings per week is $307.50.
A useful analogy for slope is to think about steps. In the image below each step has a width of 1 and a rise of 2, so for each horizontal (X) increment of 1 step, there is a 2 unit increase in the vertical measurement (Y).

If each 1 year increase in age is associated with a 2 lb. weight gain on average, then the slope for this relationship is 2. Predicted weight gain is 2 lb. per year.
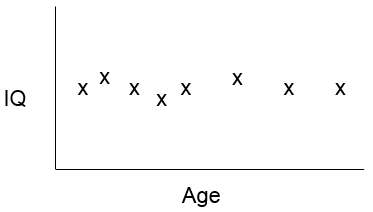
A slope of 0 means that changes in the independent variable on the X-axis are not associated with changes in the dependent variable on the Y-axis, that is, there is no association.
Consider the following example. Height and age were recorded for a group of children 4 to 15 years old, and a regression analysis indicated the following relationship:
Height (inches) = 31.5 + 2.3(Age in years)
If two children differ in age by 5 years, how much do you expect their height to differ?
The slope is 2.3, so if the children differ in age by 5 years, we would predict that the difference in height is 5 x 2.3 = 11.5 inches.
Two additional comments about this regression:
- The Y-intercept is 31.5, meaning the expected height for a person who is 0 years of age. This makes no sense. The Y-intercept in this case is not useful or interpretable. The y-intercept is only interpretable when 0 is a reasonable value for X.
- Also note that the range of x in this sample is 5-15 years. It is dangerous to extrapolate beyond the range of the data. It is tempting to use the regression equation to predict what will happen beyond the observed range, but this assumes that the relationship between the X variable and the Y variable will remain unchanged. In the example looking at height and age, the rate of growth will clearly diminish after puberty, and growth in height will eventually cease completely. As another example, a student's score on the GRE exam may increase in a fairly linear way as the number of hours of preparation increase, but there is a limit. At some point test scores will plateau regardless of more hours of study and preparation.