


Statistical Significance of a Correlation Coefficient
Note on the scatter plot above that each circle on the plot represents the X,Y pair of variables height and weight. The correlation coefficient is r=0.57. This is clearly not a perfect correlation, but remember that there are many other factors besides height that can affect one's weight, such as genetic factors, age, diet, and exercise. A variable might be a weak, but significant predictor if it is just one of many factors that determine the outcome (Y). Whether height is a statistically significant predictor of weight depends on both the strength of the correlation coefficient and the number of observations (n).
The null hypothesis for a correlation is that there is no correlation, i.e., r=0. We can evaluate the statistical significance of a correlation using the following equation:

with degrees of freedom (df) = n-2
The key thing to remember is that the t statistic for the correlation depends on the magnitude of the correlation coefficient (r) and the sample size. With a large sample, even weak correlations can become statistically significant.
Having said that, you need not memorize this equation, and you will not be asked to do hand calculations for the correlation coefficient in this course. Instead, we will use R.
Correlational Analysis Using R
Example:
Let's examine the correlation between age (AGE) and total serum cholesterol (TOTCHOL) in the dataset FramHSn500.CSV, a subset of 500 subjects from the Framingham Heart Study. The scatter plot is shown below:
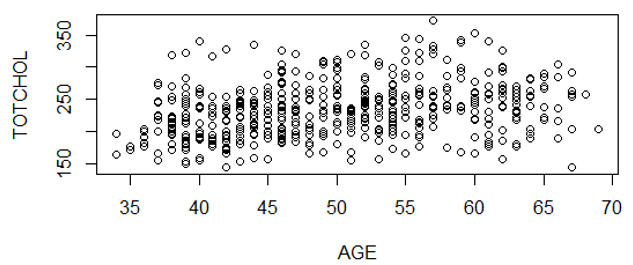
There is a lot of scatter, but there appears to be a general linear trend.
We can compute the correlation coefficient:
> cor(AGE,TOTCHOL)
[1] 0.2917043
We can also get the correlation coefficient and conduct the test of significance simultaneously by using the "cor.test" command:
> cor.test(AGE,TOTCHOL)
Pearson's product-moment correlation
data: AGE and TOTCHOL
t = 6.8056, df = 498, p-value = 2.9e-11
alternative hypothesis: true correlation is not equal to 0
95 percent confidence interval:
0.2093693 0.3699321
sample estimates:
cor
0.2917043
This output provides the correlation coefficient, the t-statistic, df, p-value, and the 95% confidence interval for the correlation coefficient.
Notice that the correlation coefficient (r=0.29) would be described as a "weak" positive association, but the association is clearly statistically significant (p=2.9 x 10⁻¹¹). There are many factors that influence one's serum cholesterol level, including genetics, diet, and other factors. This analysis suggests is that age is just one of a number of factors that are determinants of cholesterol levels.