Module 1 - Population Health
Part 1 - Asking Questions and Generating Evidence
Link to transcript of video
In this module we will establish fundamental concepts utilized in the quantitative disciplines in public health and establish a foundation that will enable you to ask research questions and evaluate data in a structured way. One of the fundamental goals of the quantitative disciplines in population health is to identify and quantify associations between potentially relevant health exposures and health outcomes. "Exposures" will be conceptualized broadly to include everything from genetic factors to social determinants of health such as poverty and race. "Health outcomes" will also be conceptualized broadly to include not only disease, but also injury, mental health, and promotion of health. We will begin to explore relationships between exposures and health outcomes and introduce the concepts of association and causation.
To apply our learning, we will discuss the MMR vaccine (measles, mumps, and rubella) and the implications for population health when the notion of causality is miscommunicated, either by accident or by design.
After completing this section, you will be able to:
Public health has provided enormous benefits to many populations, particularly in the developed world. Ironically, the general public is largely unaware of what public health is and what its functions are, partly because of the complexity of disease causation, and partly because, when public health is successful, health problems are prevented. The life of a person who develops severe heart disease might be prolonged by a dramatic and very expensive medical procedure such as heart surgery. However, public health is about interventions that prevent disease from occurring, so the benefits tend to be less obvious. In addition, prevention of disease both prolongs life and improves the quality of life. In a sense, public health is the heart disease that never developed, the epidemic that didn't happen, the outbreak of foodborne illness that never occurred, the child that would have developed asthma, but didn't. Public health is the disaster that didn't happen.
Public health in the final decades of the 20th century placed a heavy emphasis on individual responsibility for health and behavior modification. The newer definition from the CDC (Centers for Disease Control and Prevention) Foundation reflects a shift during the 21st century to a new era of "population health." In large part this shift was inspired by growing recognition of the social determinants of health and recognition of the importance of the social, cultural, and built environments. There was also growing recognition of many innovative strategies that were cropping up in cities and communities across the US. This included innovative ideas for improving the environment, safety, housing, transportation, schools and nutrition. Many of the most effective innovations were the result of collaboration across different sectors and disciplines, such as those called for by the 2002 report from the Institute of Medicine. Other factors that fostered this shift were growing disparities in health care, the threat of bioterrorism, the ever increasing cost of health care, and the need for community-based collaborations with those outside the sphere of traditional public health. Consequently, the shift to population health stresses not only the health of individuals, but the overall health of entire communities and populations.
In 1988 The Institute of Medicine issued a report entitled "The Future of Public Health," which concluded that the US public health system needed refocusing, because there was a lack of clarity regarding its roles and responsibilities. The report introduced the concept of three core functions.
In 1994 the CDC expanded the three core functions and identified ten essential services. Each essential service describes public health activities that should be undertaken in all communities, no matter how big or small.
It is likely that the ten essential functions of public health capture virtually all of the career goals of MPH students, but, in a sense, we all rely on the first two functions, monitoring and investigation, because we need the skills and tools that will enable us to identify health problems. We need to be able to keep track of the number of adverse health-related events in our populations, and we need to monitor those numbers over time in order to identify trends, the needs of the population, and the need for interventions. And we also need to keep track of health related events in order to estimate the need for future resources and be alerted to the emergence of new health problems. This requires that we have a means of measuring and tracking the frequency of health-related events in our populations. We also need to continually refine our understanding of the determinants of disease (and health), and this requires that we have methods for assessing exposures (risk factors) and health outcomes, and that we have methods for determining important associations between exposures and health outcomes. And, finally, we also need methods for determining the effectiveness of interventions.
This course provides an introduction to the quantitative and methodological approaches used in public health to ask and answer questions about health, and the course will primarily draw concepts and methods from three disciplines:
Population health science is the integrated quantitative discipline of public health that applies epidemiologic and biostatistical methods to information on health outcomes and exposures that could potentially affect health in order to answer public health questions.
For example,
Keyes and Galea make the point that individuals become ill or not, but it is the study of populations that will be most helpful in identifying the causes of health and disease. If we were to carefully compare an individual with high blood pressure to an individual from the same population without high blood pressure, we might gain clues about why hypertension occurred in one but not in the other. If we were to take a larger sample of people from a population and identify those with hypertension and those without, we would likely obtain additional insights about the causes of hypertension. However, if we were to obtain samples of people from two or three different populations, we might find that the populations differed in the frequency of hypertension, and this provides an opportunity to obtain a more complete understanding of the causes of hypertension.
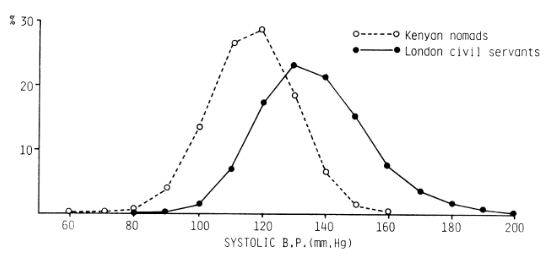
Keyes and Galea cite a paper by Geoffrey Rose comparing the distribution of systolic blood pressures in middle aged men in two populations: Kenyan nomads and London civil servants.
Source: Rose, G. (1985). "Sick individuals and sick populations." Int J Epidemiol 14(1): 32-38. As cited by Keyes and Galea.
Valuable information might be obtained by studying the causes for variation in blood pressure within each population, but greater insight would come from also understanding what caused the differences between the two populations. The two distributions are similar in shape, but the entire population of London civil servants is shifted upward from the Kenyan population, including the civil servants in the lower tail of the London population. One is then forced to consider characteristics that differ between populations in order to achieve a more complete understanding of the causes of hypertension.
Keyes and Galea conclude:
"... a focus on individual cases may render the scientist unable to identify and prevent the causes of disease that are most important in terms of health of the entire population. Epidemiologists and other public health practitioners are often utilitarian in our approach to population health by asking what causes we can intervene upon to produce the best health for the greatest number of people in the population. To do so requires studying not individuals with good or poor health, but rather the overall incidence and prevalence of health indicators across groups, asking why poor health is more common in some groups than in others. Thus, a central principle in epidemiology, and the first step in our epidemiologic rubric, is to define a population or group of scientific or public health interest."
[From Epidemiology Matters - A New Introduction to Methodological Foundations by Katherine M. Keyes and Sandro Galea, Oxford University Press, 2014]
As a general outline of how one addresses questions like these, Keyes and Galea list seven general steps.
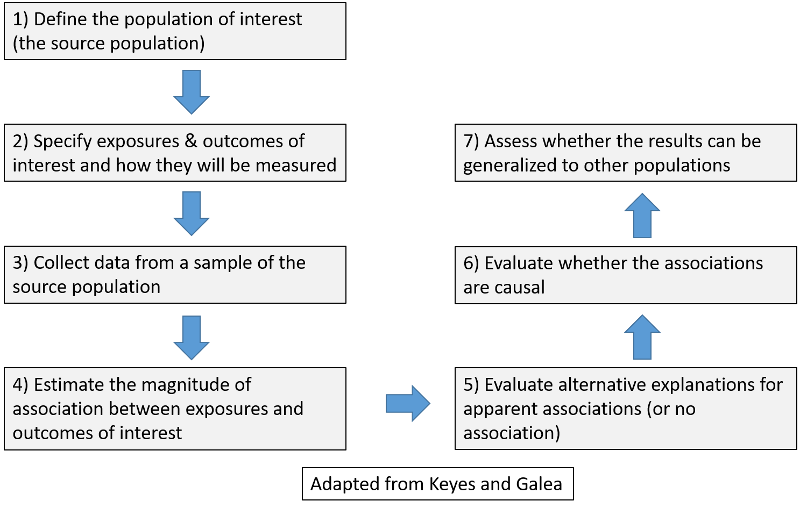
You can also download the seven steps as a word file.
We can begin by defining a population as a collection of individuals who share at least one common or organizing characteristic. While this definition is broad, it retains the flexibility to define populations in several ways depending upon the public health question of interest. How we define populations for study affects the analysis, interpretation, and generalizability of results.
When studying population health, it is useful to define study populations based on eligibility criteria, i.e., the characteristics of individuals that make them appropriate for an epidemiologic study.
There are three main categories that are useful for defining eligibility for a study population:
|
Geographic space and time, e.g., Weymouth, MA in 2002 |
|
|
A defining characteristic, event, or exposure, e.g., responders to the 9/11 attack on the World Trade Center or workers in a shipyard from 1940-1945) |
|
|
Defined by criteria that promote the likelihood of a successful study. For example, the Physicians' Health Study enrolled over 22,000 male physicians in the US to study the efficacy of low-dose aspirin to prevent heart attacks |
|
Public health questions often focus on specific geographic areas of varying size (village, city, county, state, country) over a specific period of time. People living in a specific location may have many common characteristics that might influence health, including climate, environmental exposures, culture, socioeconomic factors, nutrition, etc. Individuals born during the same period of time (birth cohorts) are often found to have a similar course with respect to health outcomes, and different birth cohorts may have dissimilar health outcomes. Since people frequently move from one place to another, geographically defined cohorts can be dynamic, with people moving in or moving out. Obviously, living within a given geographic area is the primary criterion for membership in the population. Given the dynamic nature of these studies, it is sometimes useful to think of the population as being comprised not of people, but as individual lengths of "person-time" during which each individual met the eligibility criteria. For example, consider a study population focusing on health issues in Woburn, MA from 1970-1980. An individual who moved from Los Angeles to Woburn in 1975 and then moved back to LA two years later would only have contributed 2 person-years of information to the overall study.
If one were interested in studying the health outcomes of newborn infants based on their birth weight, the study population would logically be comprised of neonates and would not necessarily focus narrowly on geography or year of birth. Similarly, the study population might be defined by an event such as the attacks on the World Trade Center and the health consequences among responders to that event. These two examples illustrate relatively stationary populations, but populations defined in this way can be dynamic, such as a study of 70-80 year-olds. During a longitudinal study, new subjects would continually become eligible, while others would become ineligible by virtue of exceeding the age limit or by dying.
The study population might also be defined based on the likelihood of achieving a successful study. For example, in 1981 the Physicians' Health Study invited all 261,248 male physicians between 40 and 84 years of age who lived in the United States and who were registered with the American Medical Association to participate in a randomized clinical trial to test the efficacy of low-dose aspirin and beta carotene in the primary prevention of cardiovascular disease and cancer. Almost half responded to the invitation, but there were also a number of other eligibility criteria and 26,062 were told they could not participate because of a prior history of myocardial infarction, stroke, cancer, or other excluding criteria.
The 33,223 who were eligible and willing were enrolled in a "run-in" phase during which all received active aspirin and placebo beta-carotene. After 18 weeks, participants were asked about their health status, side effects, compliance, and willingness to continue in the trial, and over 11,000 decided not to participate.
The remaining 22,071 physicians were then randomized to one of the four treatment arms of the study. Physicians were chosen because they could provide reliable information on questionnaires, and they would be easier to follow, particularly since they were all registered physicians. Restriction to those between 40-84 years old ensured a population at higher risk of having one of the outcomes of interest, and women were excluded because there were so few female physicians in that age group in 1981.
Finally, the run-in phase narrowed the population even further to the subset of physicians who were most likely to be able and willing to comply with the regimen over time. So, there were multiple eligibility criteria that enhanced the likelihood of a study that would successfully answer the questions being addressed.
An individual may meet the eligibility criteria to be included in a population at one point in time, but not at another. Populations with individuals moving in and out of eligibility are termed dynamic in contrast to stationary or fixed populations.
A population of homeless people would be considered very dynamic, and it would be difficult to conduct a longitudinal follow up study in them. In contrast, workers who dealt with the aftermath of the attacks on the World Trade Center (a population defined by the event) would be considered a stationary or fixed population, because they had experienced the defining event and would be considered members of that cohort until they died, even if they moved elsewhere. The distinction between dynamic and stationary populations is not strict, but it is something that should be considered when designing a study. When studying relatively dynamic populations, consideration should be given to considering data collection based on the "person-time" contributed by individuals when they were eligible. This will be discussed in greater detail in the module on measuring the frequency of health events.
When studying a population, it would be ideal to have all of the information we wanted from all members of the population. However, this is rarely possible because of the time and resources that would be required to collect the information needed. Because of this we commonly take samples that are representative of the population of interest and study them in a way that enables us to make valid inferences about the population from which they were drawn. In order to obtain accurate answers to the questions being addressed and achieve the research goals it is essential to:
These requirements go hand-in-hand, because selection of an appropriate study population is dependent upon the question being addressed. Sometimes the study population seems obvious given the research question, but the study population may be broader than that which at first seems obvious. For example, we saw previously that a study of the causes of hypertension could be conducted among male civil servants in London by comparing the characteristics of people with hypertension to those without it. However, a more complete understanding might be achieved by broadening the study population to include additional populations. When residents of Woburn, MA became alarmed by an unusually high frequency of leukemia and other diseases in the late 1970s, one avenue of study would have been to designate Woburn as the population of interest and to compare the characteristics of diseased residents to those of non-diseased residents. However, this by itself would omit other important comparisons. For example, how did the frequency of leukemia and other diseases in Woburn compare to that observed in Massachusetts in general? Or to the frequency observed across the United States? And how did environmental conditions in Woburn differ from those in other locations?
Specifying the research questions is essential to selection of an appropriate study population. There are two fundamental types of research questions that have important implications for selecting an appropriate study design.
Descriptive research aims to accurately estimate and describe the frequency of health outcomes and health-related exposures in the population; this requires a representative sample.
Questions like these require samples that are representative of the population being studied, that is comparable to the population in their characteristics. As with all studies, they also require adequate sample size in order to minimize sampling error and to obtain accurate estimates of population parameters.
This second fundamental type of research, analytic research, aims to identify determinants of disease by comparing groups of people to identify valid associations between exposures and health outcomes. This requires more restricted samples, as for example,
when The Physicians' Health Study recruited over 22,000 male physicians in the United States in 1981 to test the efficacy of low-dose aspirin (versus placebo) in preventing myocardial infarctions (heart attacks). Instead of enrolling subjects representative of the general population, they wanted to enroll a large sample of subjects who would be easy to follow for a long period of time. Physicians in the United States are registered and easy to track down, even if they move. They also wanted to enroll subjects whose age put them at risk for developing a heart attack in order to have a sufficient number of "events" to do an adequate analysis. Therefore, they enrolled subjects who were 40 to 84 years old. They also restricted the study to males, because in 1981 there were relatively few female physicians in this age range. While these restrictions increased the likelihood of achieving a successful study with a valid conclusion, they limited the ability to generalize the findings to the general population since the sample was not representative.
Questions like these also require an adequate sample size to precisely assess the strength of an association, but they differ from questions aimed at estimating frequencies in the overall population in that that they require making comparisons, e.g., comparing risk between exposed and non-exposed persons. When trying to answer questions like these regarding etiology, it is not so important that the samples be representative of the overall population. Instead, the key is to compare groups that are comparable to each other with respect to other factors that affect the outcome (so-called "confounding factors").
In the aspirin study the investigators also allocated subjects to the treatment groups randomly in order to ensure their comparability. Questions arose later regarding the applicability (generalizability) of the results to women and even to males who were not physicians, but at least the investigators could confidently conclude that low-dose aspirin had significantly reduced the incidence of myocardial infarction in the subset of the population they had studied. In fact, the random assignment of over 22,000 subjects achieved remarkable comparability among the comparison groups with respect to many known risk factors for heart disease.
When the goal is to draw a sample that is representative of the population in order to estimate population parameters, one can simple draw a simple random sample, meaning that selection is done by any method such that each individual in the study population has an equal chance of being selected, and the selection of any member does not influence the chances of any other member being selected.
Ideally, one would identify a sampling frame, i.e., a complete list or enumeration of all of the population elements (e.g., people, houses, phone numbers, etc.). Each of these is assigned a unique identification number, and elements are selected at random to determine the individuals to be included in the sample. As a result, each element has an equal chance of being selected, and the probability of being selected can be easily computed. This sampling strategy is most useful for small populations, because it requires a complete enumeration of the population as a first step.

Weymouth, MA conducted a town-wide survey in order to assess the health status of the town. The survey was mailed to a random sample of 5,054 households in Weymouth, stratified by zip code to ensure a representative sample from the entire town. Of these, 3,201 surveys were completed and returned, giving a response rate of 63.3%.
Many introductory statistical textbooks contain tables of random numbers that can be used to ensure random selection, and statistical computing packages can be used to generate random numbers. Excel, for example, has a built-in function that can be used to generate random numbers, and statistical packages such as R can also generate random numbers.
Ultimately, we would like to identify the causes of health and disease, but establishing causal relationships requires that a number of conditions are met, and we will explore this in more detail in the next section of this week's materials. For now we can simply ask "Does a certain exposure (E) cause a particular health outcome (O)?"
Exposure (E) ![]() Outcome (O)
Outcome (O)
The primary goal of analytic research is to identify determinants of health and disease. The putative causes are generally referred to as exposures, and the potential results are referred to as health outcomes.
An exposure is any measurable characteristic that differs across individuals and might affect or be associated with health or disease. Potentially relevant exposures may include any of the following:
A health outcome is any measurable disease, disability, injury, infection, syndrome, symptom, biological or subclinical marker, or health state (positive or negative). Examples might include:
Note that conditions like diabetes and hypertension can be regarded as either an exposure or a health outcome, depending on the question that is being asked, as illustrated in the examples below.
For the first question hypertension is the exposure of interest, and stroke is the outcome of interest. For the second question obesity is the exposure, and hypertension is the outcome of interest.
Another example:
For the first question type 2 diabetes is the outcome of interest, but for the second question it is the exposure of interest.
Methods of collecting data on health outcomes are varied and might include:
When considering the relationship between exposures and health outcomes, it is important to distinguish between association and causation. Epidemiologists ultimately want to be able to draw conclusions about causation, but most epidemiologic studies focus on establishing associations.
Association: Is a specified health outcome more likely in people with a particular "exposure"? Is there a link? Association is a statistical relationship between two variables.

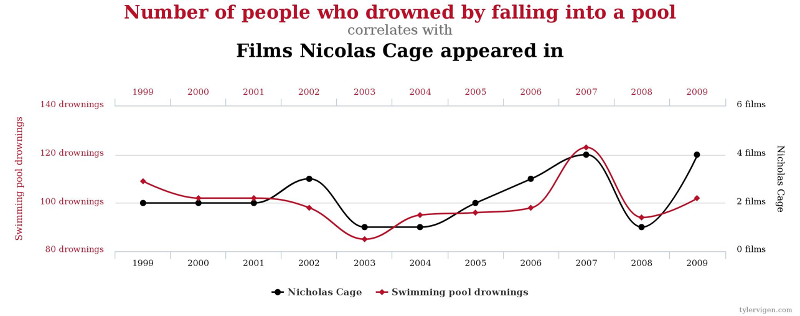
Two variables may be associated without a causal relationship. For example, there is a statistical association between the number of people who drowned by falling into a pool and the number of films Nicolas Cage appeared in in a given year. However, there is obviously no causal relationship.
Jewish women have a higher risk of breast cancer, while Mormons have a lower risk. However, one's religion is not a cause of breast cancer. There are other explanations.
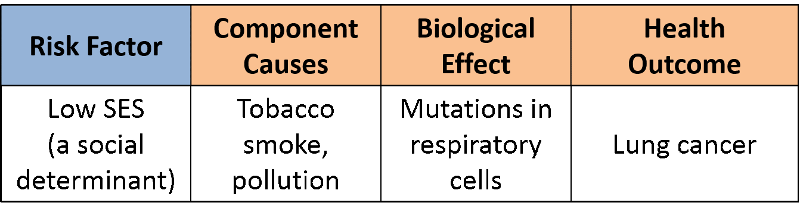
It has been convincingly demonstrated that people of lower socioeconomic status (SES) have a higher risk of lung cancer, i.e., there is a clear association, but does that mean that low SES is a cause of lung cancer? A more plausible explanation is that people of lower SES are more likely to smoke and to be chronically exposed to air pollution and that exposure of the respiratory tract to these contaminants causes mutations in bronchial cells that can eventually produce a cancer.
Causation: Causation means that the exposure produces the effect. It can be the presence of an adverse exposure, e.g., increased risks from working in a coal mine, using illicit drugs, or breathing in second hand smoke. Causative factors can also be the absence of a preventive exposure, such as not wearing a seatbelt or not exercising. A cause must be associated with the outcome, but simply demonstrating an association is not enough. To conclude that lack of exercise is a cause of heart disease, one needs to review the body of evidence suggesting a causal relationship and also consider other criteria. For example,
It is interesting to note that when lifelong smokers are told they have lung cancer or emphysema, many of them quit smoking. This makes it seem as if ex-smokers are more likely to die of emphysema or lung cancer than current smokers.
In 1976 Professor Ken Rothman, who is a member of the epidemiology faculty at Boston University School of Public Health, proposed a conceptual model of causation known as the "sufficient-component cause model" in an attempt to provide a practical view of causation which also had a sound theoretical basis.
Rothman recognized that disease outcomes have multiple contributing determinants that may act together to produce a given instance of disease. For example, exposure to someone who has TB does not necessarily result in the occurrence of TB; other conditions such as proximity to an infected person, frequency and duration of exposure, ventilation, nutritional status, and immune status also play a role in determining whether active TB will develop. Moreover, the set of determinants that produce TB in one individual may not be the same set of conditions that were responsible for the occurrence of TB in others.
Rothman defined a sufficient cause as "...a complete causal mechanism" that "inevitably produces disease." Consequently, a "sufficient cause" is not a single factor, but a minimum set of factors and circumstances that, if present in a given individual, will produce the disease.
Aschengrau and Seage use the example of causation of AIDS. A sufficient cause for AIDS might consist of the following components:
The pie chart below might be used to represent the sufficient cause model for this scenario.
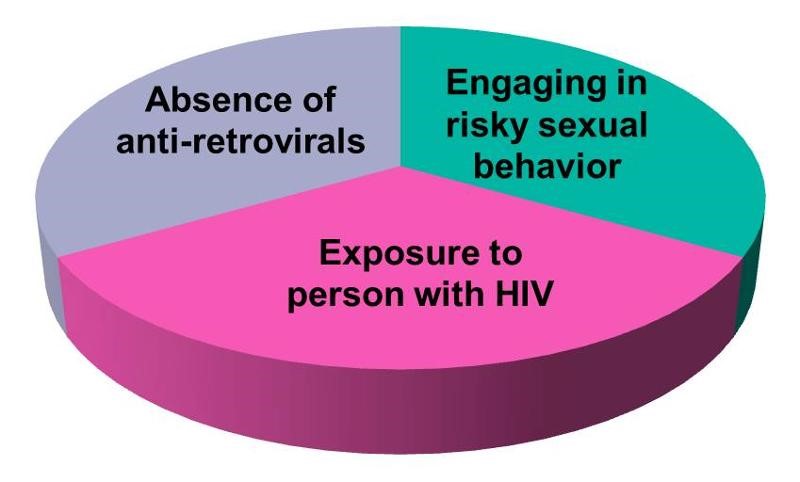
This model suggests that the presence of these three component causes is sufficient to produce AIDS in this individual. Note further that if any one of these components were absent, AIDS would not occur. Hence, Rothman asserts that a cause is an event, condition, or characteristic without which the disease would not have occurred. Note that the sufficient cause illustrated here is only one manner in which AIDS could occur. Different individuals will have different sets of individual components that combine to produce a sufficient cause (i.e., a case of AIDS).
If one were to apply the sufficient-component cause model to tuberculosis (TB), one possible cause might be represented by the pie chart below.
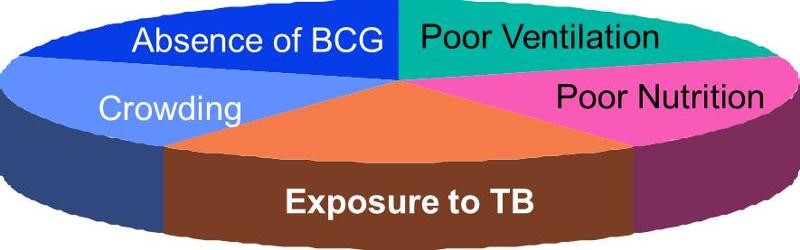
There may, however, be many sufficient causes of TB which may differ in their components, although some components might be shared among different sufficient causes. Consider, for example, the two sufficient causes below.
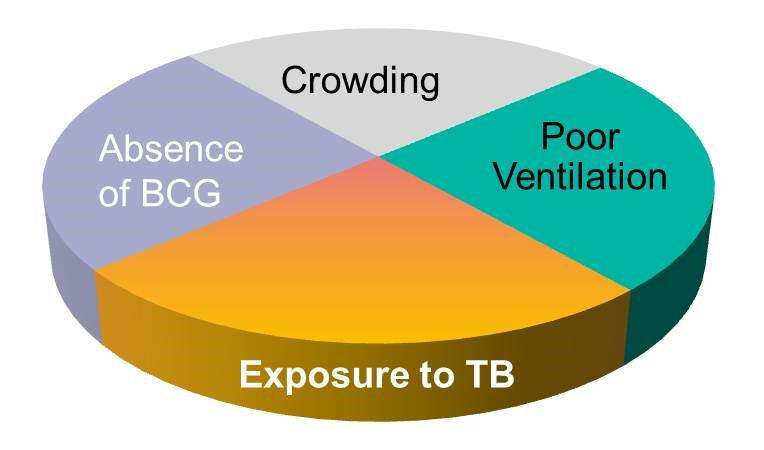
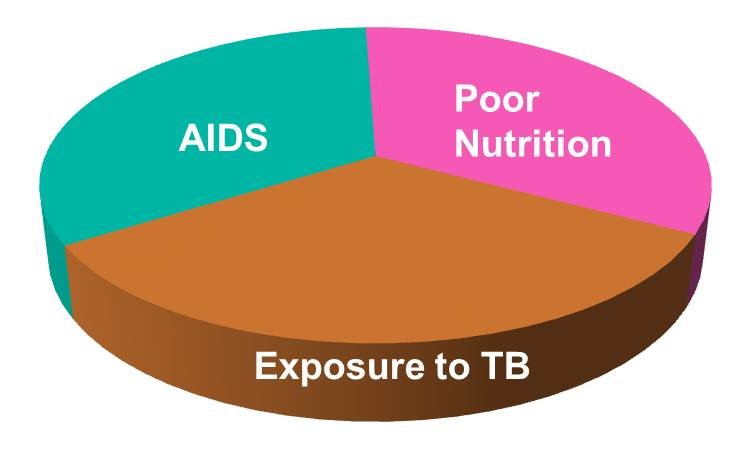
Note that exposure to TB is a component in all three of the causal models above, reflecting the fact that TB will not develop without exposure to the TB bacillus. Exposure to the TB bacillus is therefore a necessary, but not solely sufficient component cause. Other causal components must also be present for TB to occur.
Thinking about the causes of TB in this fashion underscores the complexity of disease pathogenesis, but it also alerts us to multiple opportunities to prevent disease, because removing any one of the components in a sufficient cause prevents the occurrence of disease. This perhaps provides an explanation for the remarkable decline in TB mortality in the United Kingdom during the 19th and 20th century. The line graph below shows the annual mortality from TB per 100,000 population from 1850 to 1960.
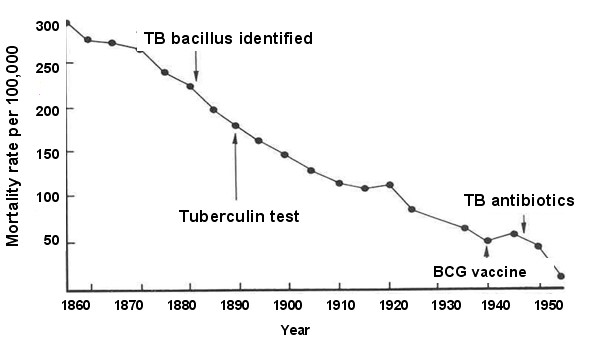
During this time span, the introduction of "the hygienic idea" and the subsequent development of public health initiatives led to gradual improvements in living conditions, including less crowding, better ventilation, and better nutrition. The decreased prevalence of these components is likely to have been responsible for the steady decline in TB mortality seen during this period. Note, however, the two points on the line graph that correspond to World War 1 and World War 11 when there are temporary increases in TB mortality. It is well known that the wars had a widespread impact on the population and that nutrition suffered and people were sometimes seeking shelter in bomb shelters that were poorly ventilated and crowded. The sufficient-component model to the left offers a coherent explanation for the steady decline in TB mortality over time and the temporary increases seen during war time.
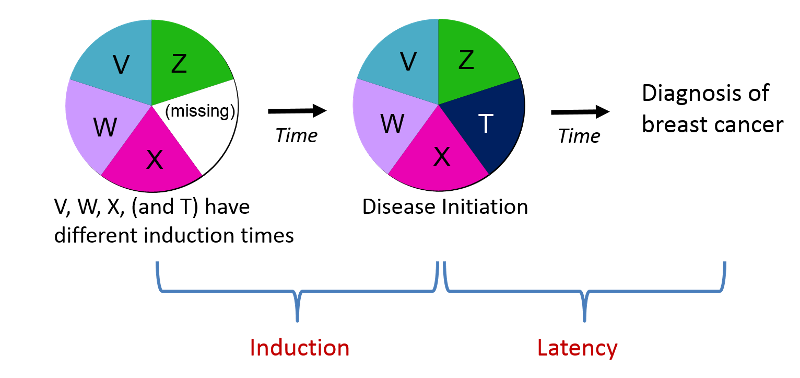
The induction period is the interval between the time of action of a component cause and the time of initiation of disease. Different components of a cause can act at different times, so they can have different induction times as illustrated in the image below.
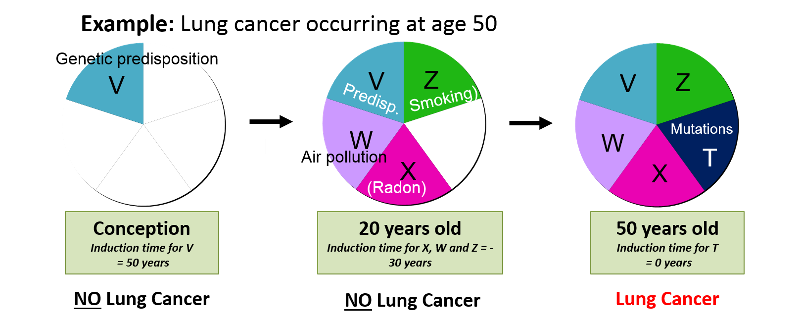
Disease is inevitable once a sufficient cause is complete, but may not be immediately evident, because:
Causal inference is the process by which we make a judgment about whether an observed association is causal. Before making such a judgment one should:
Most epidemiology studies address associations, but do not establish causality.
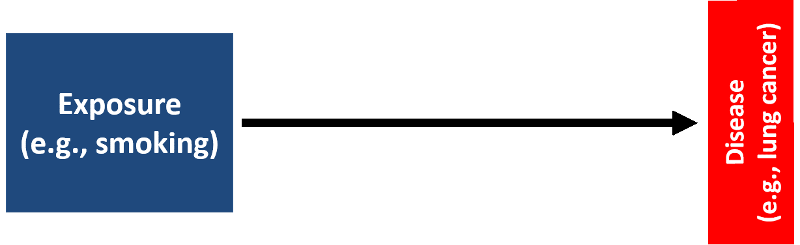
There are several models that have been used to evaluate the association between exposures and health outcome. The classic epidemiologic approach to identifying etiologic factors is the exposure-disease framework depicted below, which might be useful for exploring whether smoking is associated with an increased risk of lung cancer, for example.
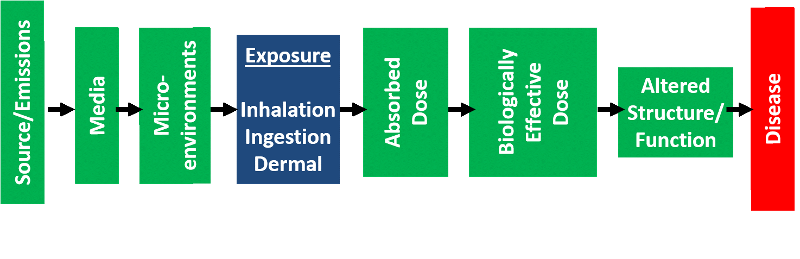
Environmental exposures are often more complex, and these often employee the conceptual model for environmental exposure-related disease , which makes it possible to summarize the possible causal pathway in more detail beginning with the source of the contaminant and taking into account the media into which it is distributed, the mode of exposure (inhalation, ingestion, or dermal absorption), the absorbed dose, the biologically effective dose, and the subsequent alterations in biologic structure and function that ultimately cause disease.
With growing recognition of the importance of social, economic, and political factors that have an impact on population health, it is also important to consider disease causation in a socio-ecological framework that conceptualizes relevant exposures not only on an individual level, but also takes into account interpersonal relationships (e.g., family, friends, social network), organizations (e.g., schools, church, social organizations), community (the cultural, natural, and built environment, and government (e.g., laws and policies that influence health).
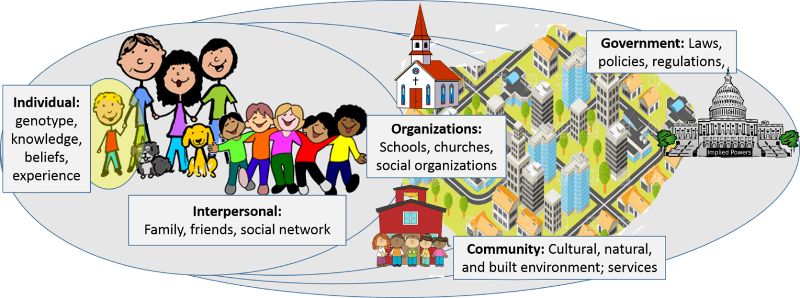
As an example, consider that one's risk of cardiovascular disease can be influenced by many component factors: inherited predisposition (one's genome), personal behaviors and choices, interpersonal relationships (what your family and friends believe and how they behave), organizations (e.g., what you are taught in school or church), the characteristics of your community (e.g., does your environment invite exercise or discourage it?), and government laws and policies (e.g., the banning of trans fats).