
Environmental Contamination
Remediation of the So. Weymouth Naval Air Station
Faculty and Students of Boston University School of Public Health
Megan Romano, MPH
Elizabeth Faye, MPH
Wayne W. LaMorte, MD, PhD, MPH, Professor of Epidemiology
Rob Schadt, EdD, Director, Office of Teaching, Learning and Technology
Wendy Heiger-Bernays, PhD, Associate Professor of Environmental Health
Richard Clapp, MPH, DSc, Professor of Environmental Health
Michael McClean, MS, ScD, Assistant Professor of Environmental Health
Contributing Authors:
Leonard Glantz, JD, Professor of Health Law, Bioethics, and Human Rights
David Sherr, PhD, Professor of Environmental Health
Veronica Vieira, MS, DSc, Research Assistant Professor of Environmental Health
Suzanne Condon, Associate Commissioner and Director of the Center for Environmental Health, Massachusetts Department of Public Health
Web Design & Development: Office of Teaching, Learning and Technology, BUSPH
This interactive educational module invites you to participate in an environmental health assessment based loosely on the evaluation and remediation of contaminants at the South Weymouth Naval Air Station (SWNAS) in Weymouth, MA. SWNAS was a real base that was in operation from 1941-1992. Like many such facilities, the base had contaminants that posed a problem for subsequent redevelopment of the land for civilian use.
SWNAS provided a realistic focus for this educational module, and much of the information used for the module is authentic, including the historical information, maps, photography and redevelopment plan for the site. However, the investigations described here are based only loosely on the actual investigation and remediation of SWNAS. Moreover, the characters are fictional and are not intended to depict real persons. We have also focused on selected contaminants and fabricated data around these in order to achieve specific learning objectives. Consequently, the scenarios depicted in this educational module should not be construed as authentic.
Notes
There are many valuable links to high quality information sources. These give you access to a wealth of useful information that will be helpful to your understanding of the case and, at the same time provide you with valuable resources for other public health problems.
Users of the module will vary in their experience and expertise, and it is not necessary that you read all of the information in all of the links. It may be helpful to at least explore all of the links in a cursory way in order to familiarize yourself with the resources that are available, since you may need them later.
There is also a link to a Resources page on the navigation menu on each page. Note also that "Other Resources" are provided on the right side of the pages, including a Glossary and a Law Library with relevant documents.
Support
This project was supported by a grant from the Information Technology Grant Program at Boston University. Support was also provided by the Local Public Health Institute of MA (Institute) and by the New England Alliance for Public Health Workforce Development ( Alliance). The Institute is a Massachusetts Department of Public Health funded entity created to strengthen local public health through training and education. It is managed by the Boston University School of Public Health Office of Public Health Practice. This publication was supported by Grant/Cooperative Agreement Number 5U90TP116997-10, Public Health Preparedness and Response for Bioterrorism, from CDC. The Alliance is funded by grant # 05-078 from the Health Resources and Services Administration (HRSA). The contents of this module are solely the responsibility of the authors and do not necessarily represent the official views of CDC nor HRSA. The authors of this module have no financial interests or relationships to disclose.

|
|
You have recently enrolled in the School of Public Health at Boston University. One of the town councilmen in Weymouth, MA , pictured here, is an acquaintance of your father, and he has phoned you to ask for your help in understanding some of the environmental health issues related to the redevelopment of the South Weymouth Naval Air Base. There has been vigorous debate in the communities, and he has received many questions from his constituents about past, present, and future health threats posed by the contamination. |
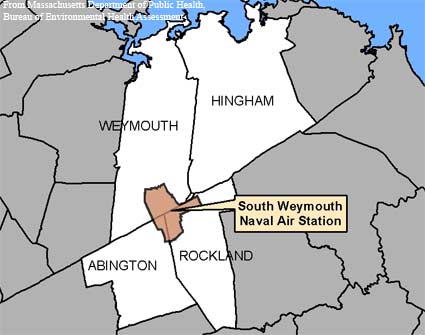
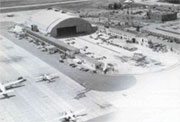 The South Weymouth Naval Air Station in Massachusetts was an active military base from 1941 to 1997, and like many military facilities of this era, environmental contamination resulted in the air station being listed on the National Priorities List. The base is now being turned over to the communities of Weymouth, Rockland and Abington to be redeveloped for civilian use. The redevelopment will create a mini-community called "Southfield," which will include housing, light industry, and a variety of recreational uses, including a golf course, playing fields for children, and camping and hiking. Follow this link to see the web pages for the marketing of Southfield.
|
|
Wendy Hunter is the environmental engineer employed by the Navy to serve as a "caretaker" for the base during the process of evaluation, remediation, and transfer of the property back to the towns. She will serve as a guide as you and the councilman explore the issues related to the remediation of this area.
|
The councilman has asked you to come see him to help him understand some of the environmental health issues related to the redevelopment of the base. There has been vigorous debate in the communities, and he has received many questions from his constituents about past, present, and future health threats posed by the contamination.
Over the past few years the Councilman has clipped various news articles which he reviews in preparation for the next town meeting. As you enter his office, the Councilman is reviewing these.
When you enter his office he has just finished another article on this issue and he's rather perturbed.
The councilman adds, "By the way, you might want to talk to Wendy Hunter; she's the environmental engineer employed by the Navy to serve as a "caretaker" for the base during the process of evaluation, remediation, and transfer of the property back to the towns."
After leaving the councilman's office you begin to collect some more information. The proposed redevelopment will create a mini-community with housing, light industry, and a variety of recreational uses, including a golf course, playing fields for children, and camping and hiking. You take a look at the developer's web site (see link below "The Village Center Plan") highlighting the redevelopment plan. The plan describes many attractive benefits.
|
|
|
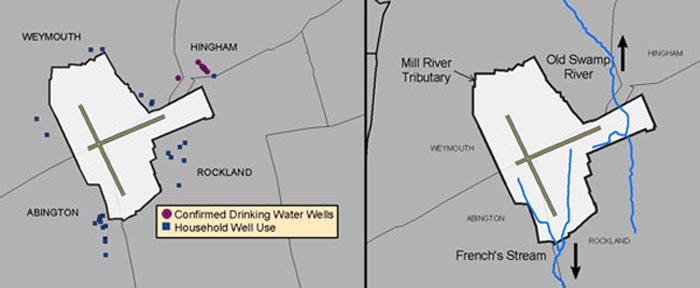
At the same time when you look at maps the councilman has given you begin to share his concern about areas of overlap. The map on the left shows areas of contamination (the colored circles inside the red outline of the air station) that were identified on the base, and the map to the right shows the proposed redevelopment plan.
|
|
You call Wendy Hunter, and she agrees to meet with you. When you mention the councilman's question about Superfund sites, she suggests that you look at the four sources listed below.
|
The next afternoon you and the councilman meet at Wendy Hunter's office on the Naval Air Station, and Wendy has several questions for you.


Wendy then provides some background on the military history of SWNAS with a short video clip.
The various activities related to the operation of the base confirm the concerns the councilman originally spoke with you about. When the the map of the base is laid over the map detailing the reuse plan, the the overlap between potentially contaminated areas and the proposed uses becomes readily apparent. To see this, move your mouse on the map to reveal the development plan.
Referring to the newspaper reports the councilor mentioned, Wendy says, "Yes, those reports stirred up a lot of concern among the residents in the surrounding communities. Citizens began to think about people living in the vicinity who had died of cancer. The Weymouth Board of Health and a number of concerned citizens from Weymouth, Rockland, and Abington asked the Massachusetts Department of Public Health to study this."

This graphic is from a town-wide health survey conducted by Weymouth in 2003.
Wendy adds, "Yes, the citizens living close to the base were particularly worried, especially those who had private wells. In addition, there are several streams that traverse or abut the air station."
What do you know about the causes of cancer?
For an interesting overiew you should review this learning module on The Biology of Cancer.
Wendy Hunter continues, "Because of these concerns, the Bureau of Environmental Health (BEH) at the Massachusetts Department of Public Health conducted a study of cancer incidence to determine whether cancer incidence was elevated in any of the surrounding communities. They used data from the Massachusetts Cancer Registry to calculate Standardized Incidence Ratios. I tried to explain to the councilor exactly what they did, but I don't think he understands this. Review the links here and perhaps you can help to clarify if for him."
Wendy points out that the Massachusetts Cancer Registry plays an important role in disease surveillance and also provides a way to evaluate the effectiveness of prevention programs.
Each year the registry publishes a series of reports. Here Dr. Richard Clapp, the first director of the Massachusetts Cancer Registry, describes its purpose and origin.
A standardized incidence ratio, or SIR, is the ratio of the number of cancers observed in a community compared to what would be expected if the community's rate was the same as the state average.
The rate of cancer is likely to vary by age, and specific communities may have age distributions that differ from that of the state overall. However, one can take this into account by using the states age-specific rates to calculate the number of cancers expected in each age bracket in the community and then adding these up. Consider the example illustrated in the table below, which considers date for a particular type of cancer, such as leukemia. Column B shows the number of residents in each of the age groups specified in column A. Column C shows the overall state average rate of leukemia for each age group. The town has 74,657 resident in the 0-19 year old age group. If they had the same frequency of leukemia as the state average (0.0001), then we would expect the town to have 74,657 x 0.0001 = 7.47 leukemias in the specified time period. The expected number of cases are listed in column D, and they are calculated for each age group by multiplying columns B & C. The last column lists the number of cases that were actually reported to the cancer registry in the specified time period. Once the table has been completed in this fashon, one can add up the number of expected cases for all age groups; in this case the sum for column D is 136.35. One can similarly compute the total number of cases observed in column E; in this case the sum is 144.
|
A) Age Group |
B) Town Population |
C) State Rate |
D) Expected Cases (BxC) |
E) Observed Cases |
|---|---|---|---|---|
|
0-19 |
74,657 |
0.0001 |
7.47 |
11 |
|
20-44 |
134,957 |
0.0002 |
26.99 |
25 |
|
45-64 |
54,463 |
0.0005 |
27.23 |
30 |
|
65-74 |
25,136 |
0.0015 |
37.70 |
40 |
|
75-84 |
17,012 |
0.0018 |
30.62 |
30 |
|
85+ |
6,337 |
0.0010 |
6.34 |
8 |
After computing the total number of observed leukemias and the total number of leukemias that would have been expected if the town had the same age-specific rates as the state average, one can then express this as the ratio of observed/expected cases. In this example the SIR would be 106.
| SIR = (O/E) x 100 = (144/136.35) x 100 = 106 |
An SIR = 106 suggests that the town's rate of leukemia was only 6% greater than expected based on the overal state average for that type of cancer.
|
Is the Incidence in Our Community Really Greater? |
|---|
|
If the community's cancer incidence were perfectly in line with the state average, the SIR would equal 100; this is the null value, meaning that there is no difference. In the previous example the SIR of 106 suggests that the rate of cancer in the community is 6% higher than the state average, but we might ask whether this increase is simply due to random variation in cancer occurrence.
For example, suppose the expected number of mesotheliomas (a cancer of the lining of the lung) is 3 for a given community, but they observe 5 in a given year. SIR = (5/3) x 100 = 167 We could interpret this as a 67% greater incidence, but it is only due to two more cases, so the increase could be simply the result of random variation in cancer occurrence rather than to a significant difference in this community.
In contrast, suppose the expected number of breast cancers for a community was 30, but they observed 50 cases during the year. This is also a 67% increase, but it represents 20 cases more than expected, and therefore raises our concern that the increase may not be simply the result of random variation. |
The next section addresses how confidence intervals can be used to interpret these findings.
Interpretation of an elevated SIR is facilitated by calculating a 95% confidence interval.The SIR represents an estimate of how much the community's cancer incidence differs from the average for the state. The 95% confidence interval for an SIR is the range within which the true SIR lies, with 95% confidence, taking into account the actual numbers that were expected and observed. If 3 mesotheliomas were expected in a community, but 5 were observed, the confidence interval would be 0-333. This very wide confidence interval means that based on these data, the true incidence ratio is somewhere between 0 and 333, with 95% confidence. This extraordinarily wide interval reflects the imprecision of our estimate and our lack of confidence in its accuracy.
In contrast, if 30 breast cancers were expected, but 50 were observed, the confidence interval would range from 120-213. Thus, the community has at least a 20% greater incidence, with 95% confidence, although the increase could be substantially higher. Note that this confidence interval does not include the null value (100). Therefore, we can interpret this as a statistically significant difference, meaning that there is less than a 5% probability that the difference observed is simply the result of random variation in cancer occurrence.
The calculation of SIR and the 95% confidence interval is automatically done for you in one of the worksheets in the Excel file "Epi_Tools.XLS," which can be downloaded from "Other Resources" to the right. This file contains a number of worksheets that perform an array of statistical calculations very simply.
Follow the link to "Epi_Tools.XLS". (Save the file on your computer.) From the main menu, click the link for "Standardized Incidence Ratio."

Mesothelioma is an uncommon type of lung cancer that is associated with exposure to asbestos and smoking. The table below summarizes actual data on the incidence of mesothelioma in Massachusetts from 1985-2000. Use these data to compute the SIR for Weymouth during this time period. Compute the SIR by hand, and then check your answer by entering these data into the worksheet for computing SIRs in the Epi_Tools.XLS spreadsheet that can be downloaded from "Other Resources" on the right. The worksheet will also compute the 95% confidence interval for the SIR. Use these computations to answer the quiz questions beneath the table.
|
Age |
MA Population 1985-2000 |
MA Cases |
MA Rate |
Weymouth Population 1985-2000 |
Weymouth Observed Cases |
|---|---|---|---|---|---|
|
45-64 |
1,230,620 |
455 |
0.00037 |
11,612 |
16 |
|
65-74 |
438,407 |
640 |
0.00146 |
4,242 |
17 |
|
75-84 |
276,570 |
522 |
0.00189 |
2,460 |
14 |
|
85+ |
99,333 |
117 |
0.00118 |
800 |
3 |


Wendy explains, "The Massachusetts DPH used calculated SIRs and 95% confidence intervals for eight different types of cancer (bladder, brain, kidney, liver, lung, leukemia, pancreas, non-Hodgkins lymphoma). Calculations were done for each of the four communities around the South Weymouth Naval Air Station. Most cancers occurred at or near the expected rates for the four towns, but there were increases in lung cancer in three of the four towns."
"These graphs show the SIRs and 95% confidence intervals for lung cancer for each of the four towns for the period from 1982-1998. The dashed horizontal line represents the null value. As you can see there were several significant increases, but there was no consistent pattern, and Hingham showed lower than average rates."

"They then looked at lung cancer SIRs within specific census tracts to get a more detailed picture of the geographic relationship of lung cancer to the SWNAS. There was no striking pattern of association in the two earliest time periods, but the pattern was noteworthy for the period from 1995 to 1998, shown below.
In the illustration below, the air station is shown in brown. Census tracts with statistically significant elevations in lung cancer are shown in pink. Increased rates that were not statistically significant are shown in blue."
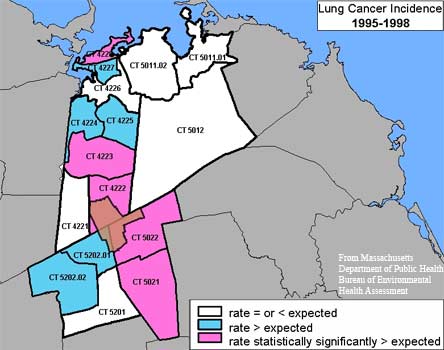

The Massachusetts Department of Public Health's Bureau of Environmental Health presented their findings at a public meeting on Feb. 13, 2002.
Assessment of Increased Cancer Rates
In summary:
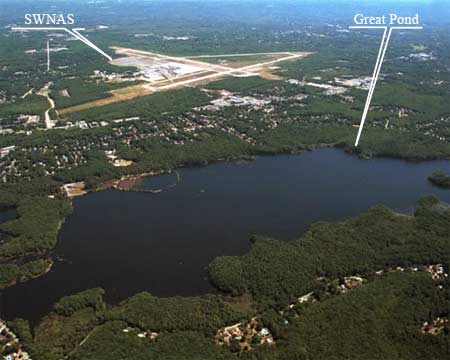
Despite this, there were concerns that sporadic elevations of arsenic in drinking water may result from varying environmental conditions in Great Pond (e.g., varying runoff) that may not be captured by testing required by drinking water regulations.
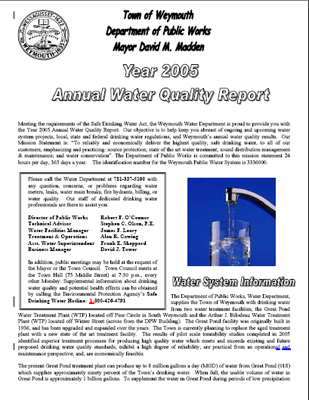
Click the thumbnail of the water report to see Weymouth's official water report for 2005. Note that some potential contaminants, such as arsenic, cyanide, and mercury, are not included because they were below measurable concentrations.
Note: This will come later after discussing exposure assessment, etc.
ATSDR Assessment of SWNAS