

Overview of Case-Control Design
In the module entitled Overview of Analytic Studies it was noted that Rothman describes the case-control strategy as follows:
"Case-control studies are best understood by considering as the starting point a source population, which represents a hypothetical study population in which a cohort study might have been conducted. The source population is the population that gives rise to the cases included in the study. If a cohort study were undertaken, we would define the exposed and unexposed cohorts (or several cohorts) and from these populations obtain denominators for the incidence rates or risks that would be calculated for each cohort. We would then identify the number of cases occurring in each cohort and calculate the risk or incidence rate for each. In a case-control study the same cases are identified and classified as to whether they belong to the exposed or unexposed cohort. Instead of obtaining the denominators for the rates or risks, however, a control group is sampled from the entire source population that gives rise to the cases. Individuals in the control group are then classified into exposed and unexposed categories. The purpose of the control group is to determine the relative size of the exposed and unexposed components of the source population. Because the control group is used to estimate the distribution of exposure in the source population, the cardinal requirement of control selection is that the controls be sampled independently of exposure status."
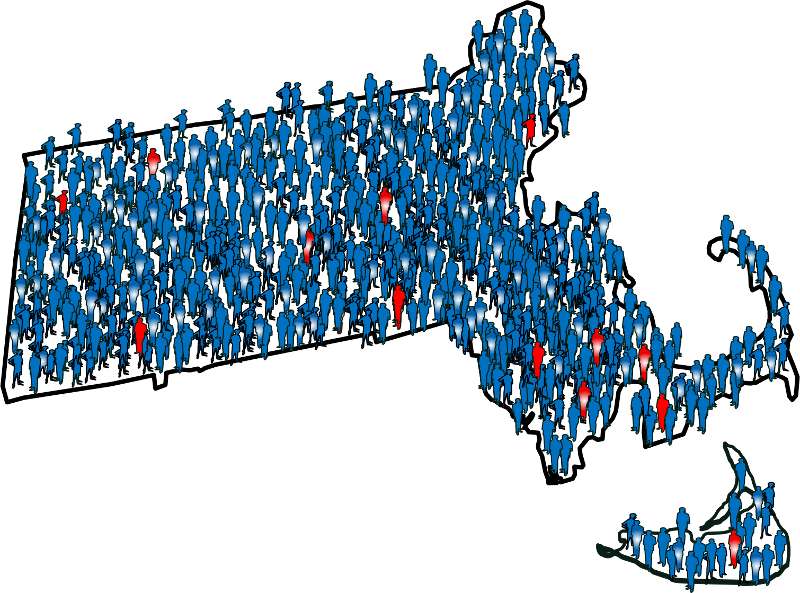
To illustrate this consider the following hypothetical scenario in which the source population is the state of Massachusetts. Diseased individuals are red, and non-diseased individuals are blue. Exposed individuals are indicated by a whitish midsection. Note the following aspects of the depicted scenario:
- The disease is rare.
- There is a fairly large number of exposed individuals in the state, but most of these are not diseased.
If we somehow had exposure and outcome information on all of the subjects in the source population and looked at the association using a cohort design, we might find the data summarized in the contingency table below.
|
|
Diseased |
Non-diseased |
Total |
|---|---|---|---|
|
Exposed |
700 |
999,300 |
1,000,000 |
|
Non-exposed |
600 |
4,999,400 |
5,000,000 |
In this hypothetical example, we have data on all 6,000,000 people in the source population, and we could compute the probability of disease (i.e., the risk or incidence) in both the exposed group and the non-exposed group, because we have the denominators for both the exposed and non-exposed groups.
The table above summarizes all of the necessary information regarding exposure and outcome status for the population and enables us to compute a risk ratio as a measure of the strength of the association. Intuitively, we compute the probability of disease (the risk) in each exposure group and then compute the risk ratio as follows:
The problem, of course, is that we usually don't have the resources to get the data on all subjects in the population. If we took a random sample of even 5-10% of the population, we would have few diseased people in our sample, certainly not enough to produce a reasonably precise measure of association. Moreover, we would expend an inordinate amount of effort and money collecting exposure and outcome data on a large number of people who would not develop the outcome.
We need a method that allows us to retain all the people in the numerator of disease frequency (diseased people or "cases") but allows us to collect information from only a small proportion of the people that make up the denominator (population, or "controls"), most of whom do not have the disease of interest. The case-control design allows us to accomplish this. We identify and collect exposure information on all the cases, but identify and collect exposure information on only a sample of the population. Once we have the exposure information, we can assign subjects to the numerator and denominator of the exposed and unexposed groups. This is what Rothman means when he says,
"The purpose of the control group is to determine the relative size of the exposed and unexposed components of the source population."
In the above example, we would have identified all 1,300 cases, determined their exposure status, and ended up categorizing 700 as exposed and 600 as unexposed. We might have ransomly sampled 6,000 members of the population (instead of 6 million) in order to determine the exposure distribution in the total population. If our sampling method was random, we would expect that about 1,000 would be exposed and 5,000 unexposed (the same ratio as in the overall population). We calculate a similar measure as the risk ratio above, but substituting in the denominator a sample of the population ("controls") instead of the whole population:
Note that when we take a sample of the population, we no longer have a measure of disease frequency, because the denominator no longer represents the population. Therefore, we can no longer compute the probability or rate of disease incidence in each exposure group. We also can't calculate a risk or rate difference measure for the same reason. However, as we have seen, we can compute the relative probability of disease in the exposed vs. unexposed group. The term generally used for this measure is an odds ratio, described in more detail later in the module.
Consequently, when the outcome is uncommon, as in this case, the risk ratio can be estimated much more efficiently by using a case-control design. One would focus first on finding an adequate number of cases in order to determine the ratio of exposed to unexposed cases. Then, one only needs to take a sample of the population in order to estimate the relative size of the exposed and unexposed components of the source population. Note that if one can identify all of the cases that were reported to a registry or other database within a defined period of time, then it is possible to compute an estimate of the incidence of disease if the size of the population is known from census data. While this is conceptually possible, it is rarely done, and we will not discuss it further in this course.