


Risk Differences and Rate Differences
Risk Differences
Instead of comparing two measures of disease frequency by calculating their ratio, one can compare them in terms of their absolute difference. The risk difference is calculated by subtracting the cumulative incidence in the unexposed group (or least exposed group) from the cumulative incidence in the group with the exposure.


where (CIe) = cumulative incidence among the exposed subjects, and (CIu) is the cumulative incidence among unexposed subjects.
The risk difference focuses on absolute effect of the risk factor, or the excess risk of disease in those who have the factor compared with those who don't. Recall that in the wound infection study, the cumulative incidence of infection was 5.3% in the incidental appendectomy group, and only 1.3% in the group without appendectomies. The risk ratio was 4.2, but we can also compute the absolute difference, which is 5.3/100 - 1.3/100 = 4 per 100 excess wound infections among those who had the incidental appendectomy. CIu provides an estimate of the baseline risk (i.e., in the absence of the exposure), and the exposure factor imposes an additional (excess) risk on top of that.
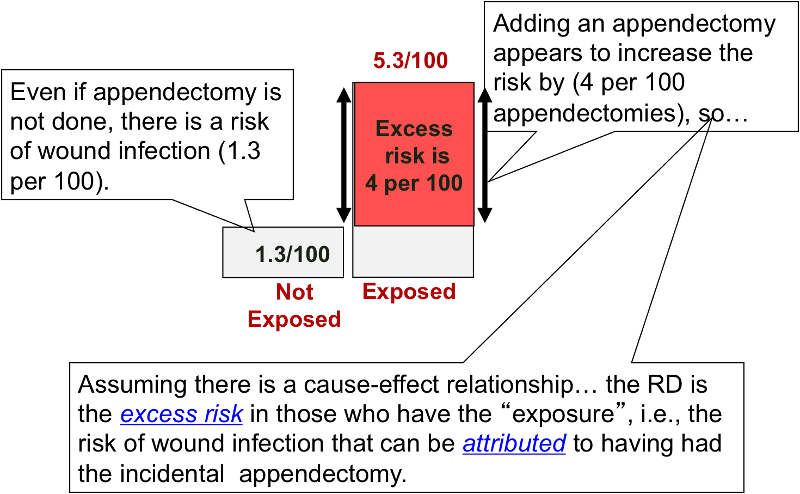
An older term for the risk difference is "attributable risk," that is the excess risk than can be attributed to having had the exposure. However, many discourage the use of this terminology because it presumes a causal relationship between the exposure and the outcome.
Note also that any measure of association in a single study, whether a ratio or difference, should be considered one estimate of the true causal relationship.

Rate Differences
Analogous to the risk difference, the rate difference is calculated by subtracting the incidence rate in the unexposed group (or least exposed group) from the incidence rate in the group with the exposure.

where (IRe) = incidence rate among the exposed subjects, and (IRu) is the incidence rate among unexposed subjects.
When we compute a rate ratio, the units of person-time in the denominator cancel out because of division. However, a rate difference is based on subtraction of incidence rates, so the units are retained. In the Nurses' Health Study, the difference between highest and lowest weight categories was about 62.3 cases per 100,000 person-years (see figure to the right). If you followed another 100,000 women with BMI's >29 for one year, you would expect about 85 of them to have a non-fatal MI, and we could attribute about 62 of these to their obesity. Conversely, if you got these 100,000 women to lose enough weight to get them down into the leanest category, you might expect to prevent about 62 non-fatal MIs.
Note that interpretation of risk difference in this way is based on the assumption that there is both a valid association (not due to random error, bias or confounding) and the assumption that there is a cause-effect relationship between the exposure and the disease.
Interpretation: Nurses who had a BMI>29 had 62.3 additional cases of non-fatal myocardial infarction per 100,000 person-years compared to nurses who had a BMI<21.
Tip #4: Because person-year units are retained in the denominator, the rate difference, can never be reported as a percentage.

Perspective of Relative Differences (Ratios) vs. Absolute Differences
Relative risk comparisons and risk differences provide two different perspectives on the same information.
- Relative risk, i.e., risk ratios, rate ratios, and odds ratios, provide a measure of the strength of the association between a factor and a disease or outcome.
- Risk difference, i.e., absolute risk,.provides a measure of the public health impact of the risk factor, and focuses on the number of cases that could potentially be prevented by eliminating the risk factor.
Example:
How effective is fecal blood testing as a screening test for colorectal cancer?
A study found that people over age 40 who were screened had a 33% reduction in death (i.e. RR = 0.67) from colorectal cancer compared to people who were not screened; in other words those who were screened had 0.67 times the risk of death from colorectal cancer. However, the incidence of death in the screened group was 6 per 1,000 people, and the incidence of death in the unscreened group was 9 per 1,000. In other words, screening may have saved 3 lives per 1,000 people screened. A 33% reduction sounds like a lot, but when you consider that the risk difference was perhaps only 3 per 1,000 screened, it doesn't sound like as much of a benefit.
