


Comparing Mean HDL Levels With Regression Analysis
Consider a clinical trial to evaluate the efficacy of a new drug to increase HDL cholesterol. We could compare the mean HDL levels between treatment groups statistically using a two independent samples t test. Here we consider an alternate approach. Summary data for the trial are shown below:
|
|
Sample Size |
Mean HDL |
Standard Deviation of HDL |
|---|---|---|---|
|
New Drug |
50 |
40.16 |
4.46 |
|
Placebo |
50 |
39.21 |
3.91 |
HDL cholesterol is the continuous dependent variable and treatment assignment (new drug versus placebo) is the independent variable. Suppose the data on n=100 participants are entered into a statistical computing package. The outcome (Y) is HDL cholesterol in mg/dL and the independent variable (X) is treatment assignment. For this analysis, X is coded as 1 for participants who received the new drug and as 0 for participants who received the placebo. A simple linear regression equation is estimated as follows:

where Y is the estimated HDL level and X is a dichotomous variable (also called an indicator variable, in this case indicating whether the participant was assigned to the new drug or to placebo). The estimate of the Y-intercept is b0=39.21. The Y-intercept is the value of Y (HDL cholesterol) when X is zero. In this example, X=0 indicates assignment to the placebo group. Thus, the Y-intercept is exactly equal to the mean HDL level in the placebo group. The slope is estimated as b1=0.95. The slope represents the estimated change in Y (HDL cholesterol) relative to a one unit change in X. A one unit change in X represents a difference in treatment assignment (placebo versus new drug). The slope represents the difference in mean HDL levels between the treatment groups. Thus, the mean HDL for participants receiving the new drug is:
 -----
-----

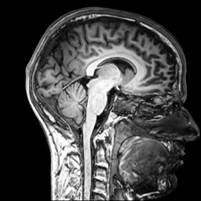
A study was conducted to assess the association between a person's intelligence and the size of their brain. Participants completed a standardized IQ test and researchers used Magnetic Resonance Imaging (MRI) to determine brain size. Demographic information, including the patient's gender, was also recorded.