
Noise Monitoring
Exposure assessments looking to estimate exposure levels to noise have commonly been conducted in occupational health settings since certain occupations are potentially exposed to damaging levels of noise, such as construction workers and public safety workers. Traditionally the health outcome of concern was hearing loss which tends to be associated with occupational exposure levels. However, investigators are increasingly interested in examining the non-hearing-loss-related effects of environmental noise exposure.
There are two major types of sensori-neural hearing loss: age-related and noise-induced. Age-related hearing loss tends to be a cumulative effect of aging that results in loss in loudness where individuals tend to lose higher frequencies and it tends to affect men more than women. Noise-induced hearing loss results from damage to the hair cells or auditory nerves and includes loss of hearing clarity of low frequencies (vowels) and high frequencies (consonants). In addition to the effects on hearing, noise exposure can also result in non-auditory effects, such as annoyance, stress, hormone irregularity, cardiovascular disease, and interaction with other occupational and environmental exposures.


There are many sources of environmental noise. Noise pollution is of increasing concern due to research demonstrating its association with adverse health effects Try to list as many environmental sources of noise, particularly in an urban setting that can contribute to noise pollution.
Characterizing Noise Exposure
In order to assess the effects of noise on a given population, investigators must be able to measure and interpret noise data. The table below highlights some important definitions and measurements used to characterize noise exposure.
Key Definitions, Concepts and Formulas
Sound: Vibration of spring-like air "particles" due to an oscillating surface, such as a vibrating tuning fork.
Sound propagation: Vibrating particles exert a force on adjacent particles, causing them to vibrate thereby generating alternating regions of pressure that are slightly higher and lower than atmospheric pressure
Sound waves: Consists of wavelengths, which are the distance between maxima (shown below) and frequency, which are the number of waves per second. The image below illustrates a speaker membrane sending trains of compression waves to the ear. Individual molecules oscillate about fixed positions.
Frequency: The number of cycles per unit of time often measured in Hertz (Hz). Frequency is related to the wavelength of sound. The wavelength is the distance in space required to complete a full cycle of a frequency.
Sound pressure level (SPL): A logarithmic measure of the ratio between the actual sound pressure and a fixed reference pressure (formula below). The reference pressure used in the formula is usually that of the threshold of hearing, which is 20 μPa. SPL is typically used to measure magnitude of sound. Note that Lp is the sound pressure level and p0 is the reference sound pressure.
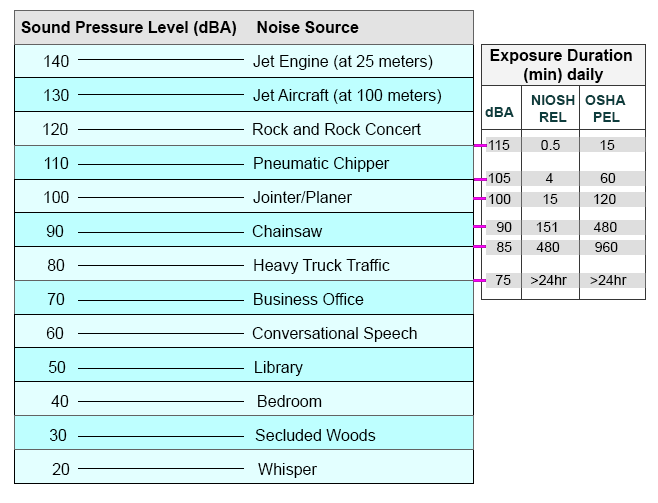
A 1dB change in sound level is not perceptible to the human ear. Generally it takes a change in noise by 5 dB before the change can be clearly perceived by the human ear and a change by 10dB is perceived as twice (or half) as loud. This is an important consideration when conducting exposure assessments. If an investigator is conducting an exposure assessment to characterize exposure to noise in different locations, even though there may be differences in noise levels from one location to another, these changes may not be meaningful unless they are large enough.
The image below provides examples of sources at different sound pressure levels with the table on the left. The appended table on the right includes the SPL and exposure duration under both NIOSH recommended exposure limits (RELs) and OSHA permissible exposure limits (PELs). Note the difference in exposure duration between what is recommended and what is permitted.
Measuring Noise Exposure
In order to collect data on noise, investigators must identify the sampling equipment that will best suit the objectives of the study. The table below provides some examples of the type of equipment that can be used to capture and collect noise data.
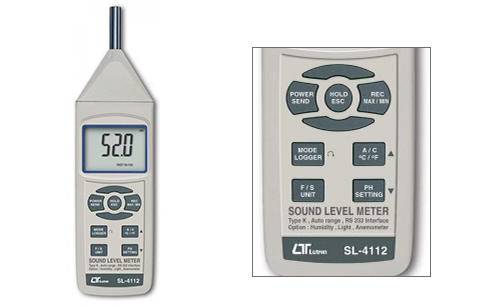
Sound Level Meter
The sound level meter shown below is an instrument that measures sound pressure level. It can be used to identify and evaluate individual noise sources for abatement purposes and can aid in determining the feasibility of engineering controls for individual noise sources. Another use of the sound level meter is to spot-check noise dosimeter performance.
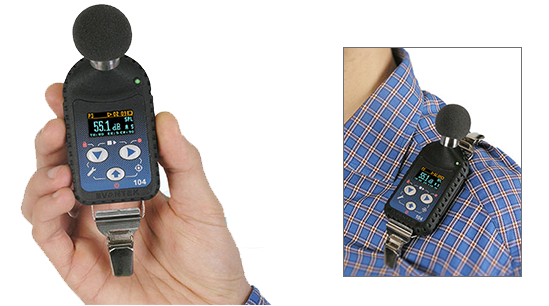
Noise Dosimeter
A noise dosimeter is very similar to a sound level meter except that it can be worn by an employee to determine the personal noise dose during the workshift sampling period. The image below illustrates how a noise dosimeter can be attached to clothing to capture personal exposure levels. They are often used to make compliance measurements according to OSHA noise standards. They can measure an employee's exposure to noise and automatically compute the necessary noise dose calculations.
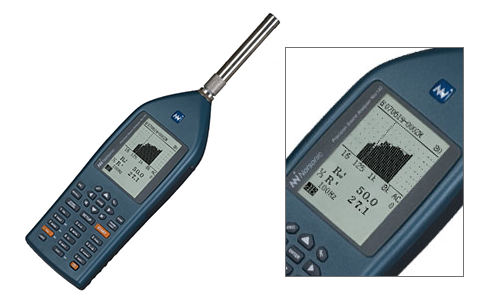
Octave Band Analyzer
An octave band analyzer is a sound level meter that divides noise into its frequency components. This allows for further characterization of noise beyond a simple measure in decibels. Shown below is an example of octave band analysis. Note that the analysis allows for more detailed information regarding the breakdown of frequencies that make up the noise. It helps determine the effectiveness of various types of frequency-dependent noise controls, such as barriers and personal protective equipment (PPE). The special signature of any given noise can be obtained by taking sound level meter readings at each of the center frequency bands.
Loudness and A-Weighting Scale
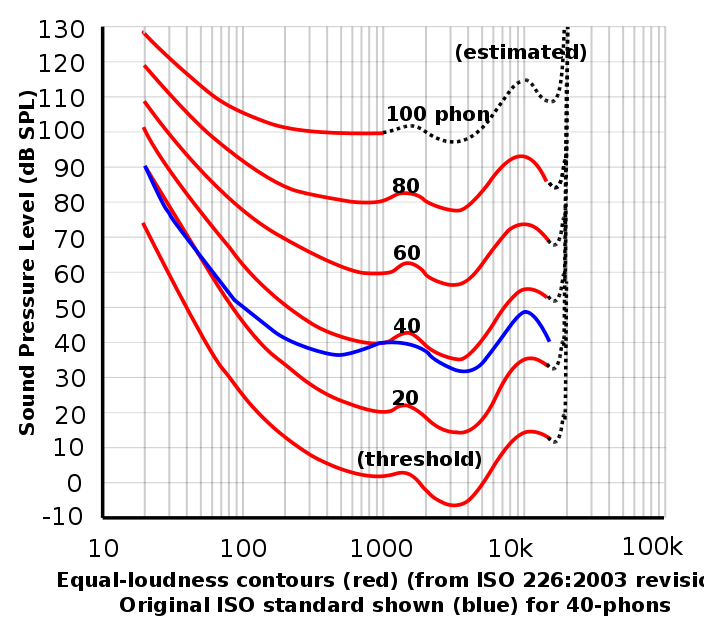
We have discussed measurements that are based on objective measures, specifically the decibel scale and the intensity levels it is based on. However, sounds with equal intensities but different frequencies are perceived to have unequal loudness. For example, an 80 dB sound with a frequency of 1000 Hz sounds louder than an 80 dB sound with a frequency of 500 Hz. To account for this subjective measure, the unit "phon" is used to indicate perception of loudness. One phon is equivalent to 1 dB at 1000 Hz. The diagram below displays equal loudness contours.
To compensate for this difference in loudness due to frequency, a frequency-dependent correction is made. The A-weighting scale is the most commonly used weighting scale for this correction. When sound pressure levels are corrected in this way, the units are designated as dBA, rather than dB.
Practical Application
Transportation Noise and Blood Pressure in a Population-Based Sample of Adults is an article by Dratva et al that examines the effects of transportation noise on blood pressure with a secondary aim to look at these potential effects in vulnerable sub-populations. Review the introduction and study methods prior to answering the questions below.