

Epidemic Curves
An "epidemic curve" shows the frequency of new cases over time based on the date of onset of disease. The shape of the curve in relation to the incubation period for a particular disease can give clues about the source. There are three basic types of epidemic curve.
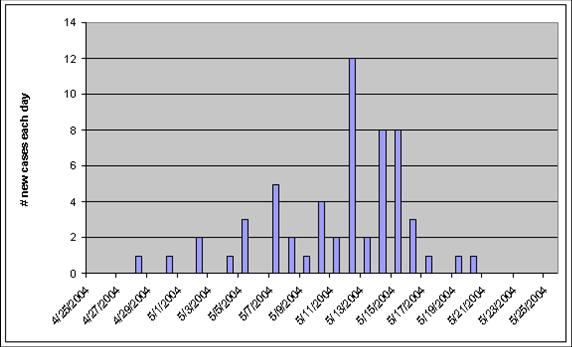
Point source outbreaks (epidemics) involve a common source, such as contaminated food or an infected food handler, and all the exposures tend to occur in a relatively brief period. Consequently, point source outbreaks tend to have epidemic curves with a rapid increase in cases followed by a somewhat slower decline, and all of the cases tend to fall within one incubation period. The graph above from a hepatitis outbreak is an example of a point source epidemic. The incubation period for hepatitis ranges from 15-50 days, with an average of about 28-30 days. In a point source epidemic of hepatitis A you would expect the rise and fall of new cases to occur within about a 30 day span of time, which is what is seen in the graph below.
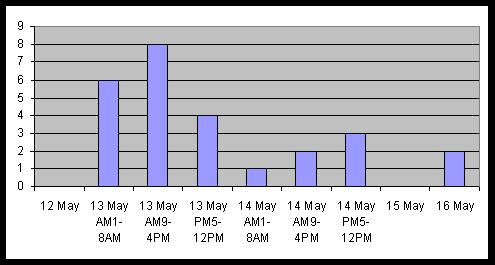
Continuous common source epidemics may also rise to a peak and then fall, but the cases do not all occur within the span of a single incubation period. This implies that there is an ongoing source of contamination. The down slope of the curve may be very sharp if the common source is removed or gradual if the outbreak is allowed to exhaust itself. The epidemic curve below is from the cholera outbreak in the Broad Street area of London in 1854 that was investigated by Dr. John Snow. Cholera has an incubation period of 1-3 days, and even though residents began to flee when the outbreak erupted, you can see that this outbreak lasted for more than a single incubation period. This suggests an ongoing source of infection, in this case the Broad Street pump.
Propagated (or progressive source) epidemic. The epidemic curve shown below is from an outbreak of measles that began with a single index case who infected a number of other individuals. (The incubation period for measles averages 10 days with a range of 7-18 days.) One or more of the people infected in the initial wave infected a group of people who become the second wave of infection. So here transmission is person-to-person, rather than from a common source. Propagated epidemic curves usually have a series of successively larger peaks, which are one incubation period apart. The successive waves tend to involve more and more people, until the pool of susceptible people is exhausted or control measures are implemented. This is an ideal example, however; in reality, most of these epidemics do not produce the classic pattern.
For some outbreaks the descriptive information is all that is needed to figure out the source, and control measures can be undertaken rapidly. In other cases, this descriptive information (person, place, and time) helps generate hypotheses about the source, but it isn't obvious what the source is. When this occurs, it is necessary to test the hypotheses by conducting an analytical study, i.e. either a case-control study or a cohort study. This means collecting data and analyzing it in order to identify the source. After the hepatitis outbreak in Marshfield, DPH conducted a case-control study. After an outbreak of Giardia in Milton, MA, a retrospective cohort study was conducted. However, it is important to recognize that you can't test a hypothesis unless you have one to test. So, the descriptive studies that generate hypotheses are essential.
Use the graph below to answer this "Quiz Me."