


Variability in Means Obtained from a Sample
So far, we have been discussing the probability that a person or persons will have a value less than or greater than a certain value, but now we are shifting gears and building on those concepts. Instead of asking about the probable results when we select a random person from a normally distributed population, we will now consider the situation when we are selecting a random sample from a population to estimate a mean.
The standard deviation provided a measure of variability among individuals within the population, but now we need to address the issue of variability in the estimates of means obtained from samples of individuals.
Let's go back to our normally distributed population of 60 year old men. If I were to take one sample, I could compute an estimate of the mean and the SD of the population, and if the sample were large, I would probably get estimates close to the true mean and SD of the entire population.
However, if I were to take multiple samples (e.g., n=10 in each sample) and computed the mean of each sample, the means would also conform to a normal distribution. In the image below the outermost bell-shaped curve represents the distribution of individual BMI measurements among the men in the population. This distribution has a mean of 29 and SD=6.
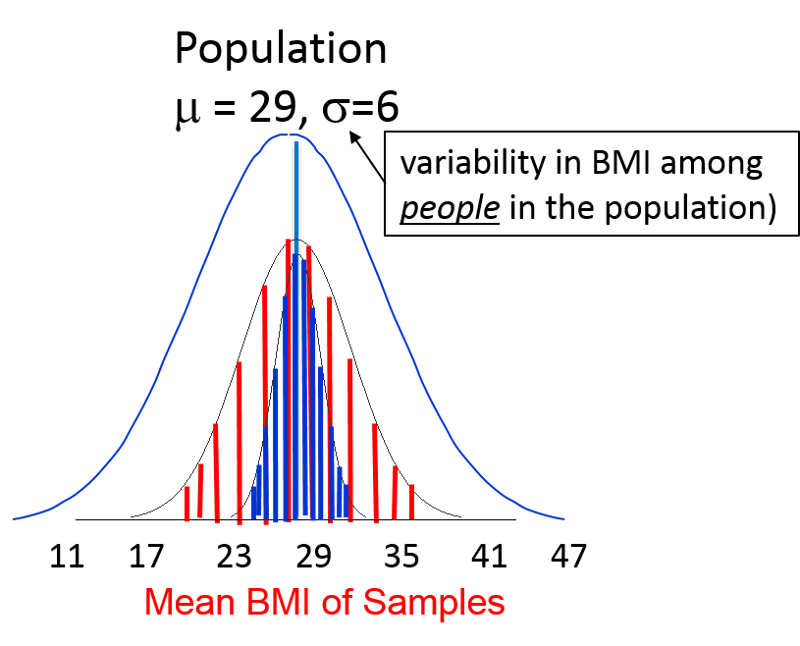
The mean of the sample means would be very close to μ, the mean for the population from which the samples were drawn. However, the variability in the sample means will depend on the size of the samples, since larger samples are more likely to give estimated means that are closer to the true mean of the population. In the figure above, the vertical red lines represent the distribution of means obtained with samples of n=10. The vertical blue lines represent the distribution of sample means that might be obtained with a larger sample, say n=30. Therefore, the variability in the sample means depends on the sample size, and it turns out that the variability in sampling means can be estimated as follows:


In the example above the standard deviation was 6. If we took a sample of 10 subjects, the standard error of the mean would be as follows:
However, if we took a sample size of n=50, then the SE becomes smaller.
So, as the sample size increases, we obtain greater precision in the estimated mean.
We should also note that we almost never know the true mean and standard deviation of the population, but we can estimate the standard deviation in the population from the standard deviation in the sample, because the variability in individual measurements within a sample will be similar to the individual variability in the overall population. So, I can use the SD of a sample to estimate the SD of the population, and I will use this estimate of population SD to compute the SE, which is the standard deviation of the sample mean (SE).
