Graphs
# Make a histogram of the age distribution
hist(age)

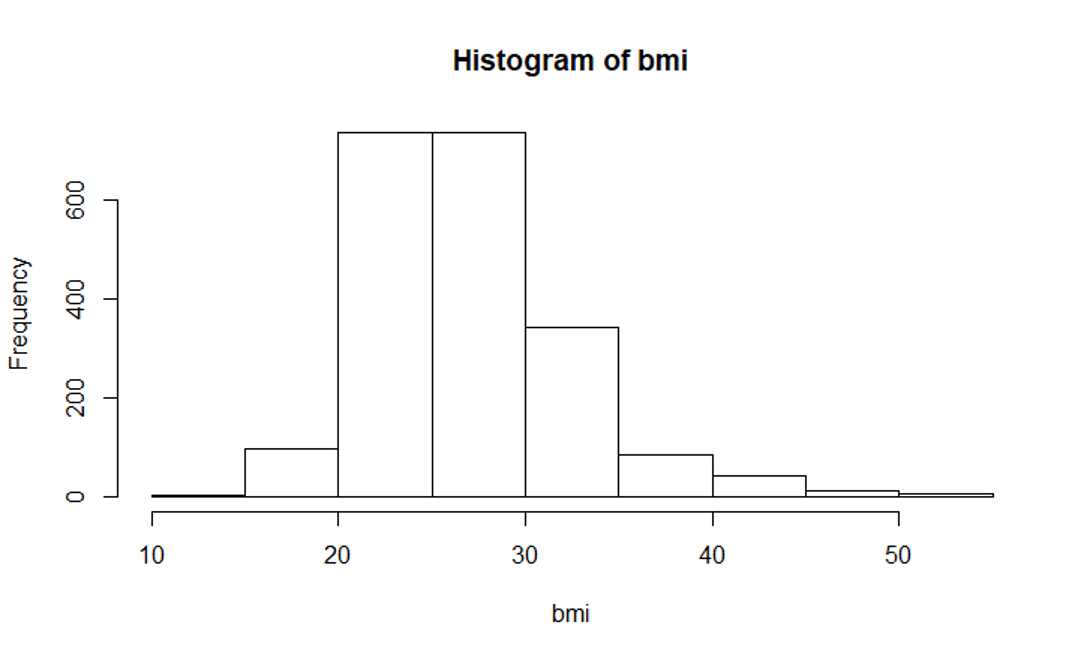
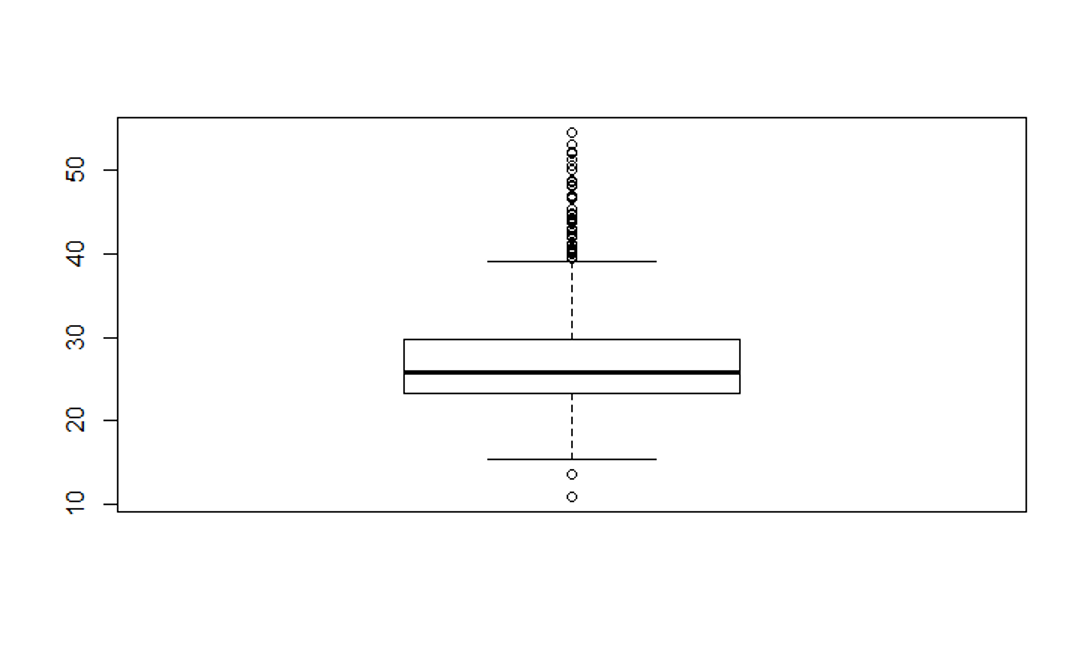
# Make a histogram and a boxplot of bmi
hist(bmi)

Next
boxplot(bmi)

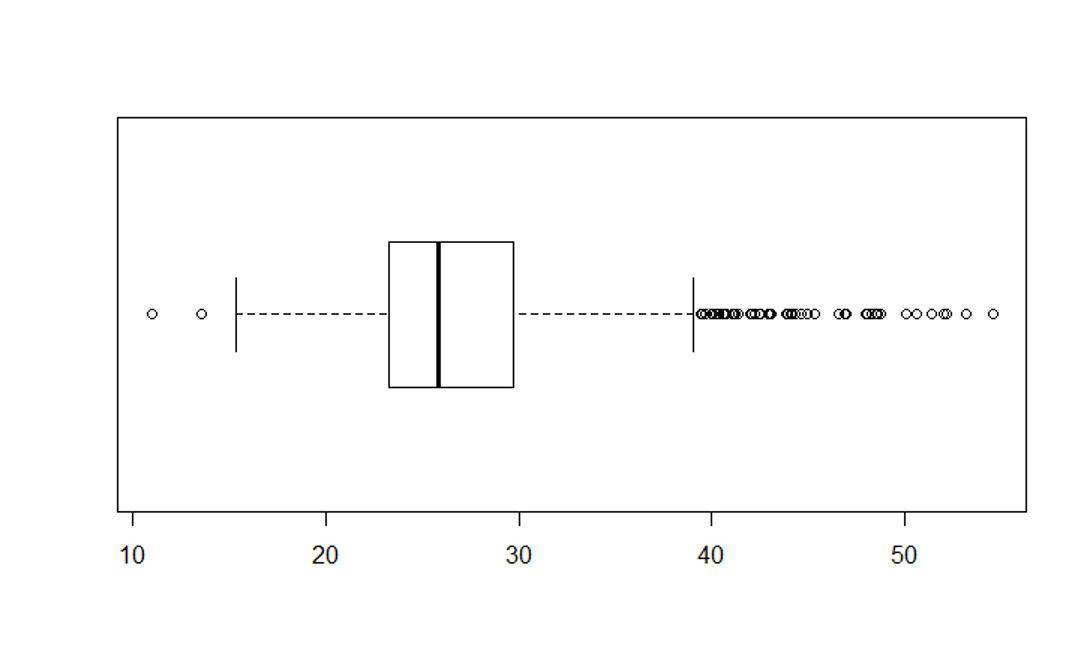
# Next, modify the boxplot to a horizontal orientation
boxplot(bmi, horizontal = TRUE)

# Modify the BMI histogram with the code below
hist(bmi, main="BMI Distribution in Weymouth Adults",
xlab = "BMI", border="blue", col="green", xlim=c(10,50),
las=1, breaks=8)

Once you have everything working, save your script for future reference. You will be using these coding functions throughout the course.

