


Onset of the Outbreak Investigation
Steps in an Outbreak Investigation
A separate online module provides a useful summary of how to conduct outbreak investigations. One section in particular discusses the steps that are undertaken in a typical outbreak investigation. You should review these.

 |
These are steps that are undertaken in most outbreak investigations. Drag and drop them to the slots on the right, placing them in the order in which they are generally undertaken in an outbreak investigation. |
|
This content requires JavaScript enabled.
|
|
Identifying an Outbreak
Dr. Richard Dicker points out that outbreaks are identified either by regular analysis of surveillance data or, more commonly, through calls from a health care provider or citizen who knows of several cases. A small cluster of similar cases might seem unusual, although the total number of cases and the denominator for the population are frequently unknown. Consequently, it is important to verify that an apparent outbreak is real by comparing the number of cases during the current time period with what one has observed during preceding periods.
One needs to consider that an increase in the reported number of cases could also be due to:
- Changes in local reporting procedures
-
Changes in the case definition
-
Improvements in diagnostic or screening procedures
-
Increased attention to the disease because of local or national interest
-
Changes in the age distribution of the population
-
Influx of significant numbers of new permanent or temporary residents.
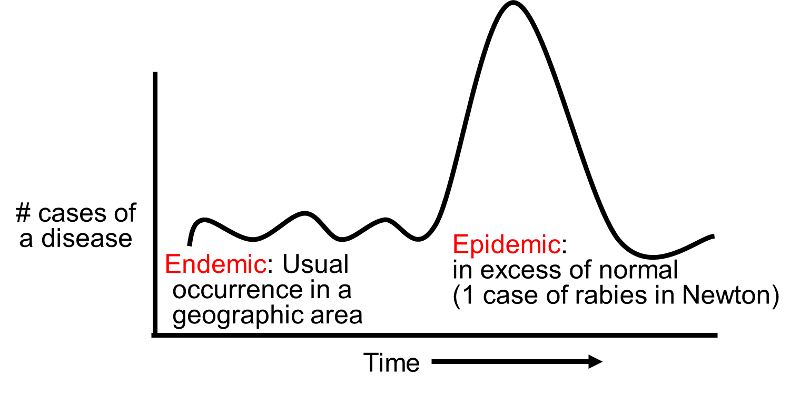
Endemic, Epidemic, & Pandemic
The term endemic refers to the usual frequency of a disease occurring in a particular location. An epidemic can be defined as an increase in the frequency of disease over and above the endemic rate. The terms "epidemic" and "outbreak" are synonymous. Finally, the term pandemic refers to the presence of multiple epidemics across the globe. These are relatively loose definitions, and there are no strict criteria that distinguish these terms. For example, if a community has historically been unaffected by rabies, then the occurrence of a single case might logically be classified an epidemic of sorts, particularly since its occurrence would indicate a potentially important increase in potential risk of future cases. It should also be noted that the word "pandemic" is frequently mistaken to imply an epidemic of severe disease, i.e., of particular virulence. However, this is incorrect; regardless of severity, it refers to the simultaneous occurrence of multiple epidemics across the globe.
Case Definitions
Barstow points out,
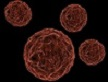
"Of course, before we got too carried away counting cases, we had to confirm the diagnosis, confirm that there was an unusual number of cases, and then decide on a case definition. All four of the first cases had a typical clinical picture (jaundice, fever, nausea, vomiting, fatigue, loss of appetite), and they also had blood tests that showed elevated concentrations of bilirubin and liver enzymes. They also had anti-hepatitis A IgM antibodies. The symptom complex of jaundice, fever, nausea, vomiting, fatigue, loss of appetite was useful for finding potential cases, but the ultimate determination of whether someone was a 'case' or not depended on the lab test to see if they had elevated IgM for HAV."
You will find it useful to review this brief discussion on confirming the presence of an outbreak.
A case definition is a standard set of criteria used to define individuals who are cases. A specific definition helps identify and count cases consistently over time and from place to place. The components of a case definition include:
- Clinical criteria: these should be simple e.g. for hepatitis A these might include fever >101, jaundice in combination with nausea, vomiting or diarrhea, and elevated levels of IgM antibodies for hepatitis A. The case definition should also consider exclusions or restrictions.
- Restrictions by time, place, and person (e.g. for example for this case one might include only persons who became jaundiced in Sparta during April, May or June for reasons other than gallstones.)
Criteria for a case definition should be simple, objective, and discriminating (i.e. able to distinguish between people with disease and those without disease.
Also, case definitions should not include risk factors that you may want to evaluate, since all of the cases would have the risk factor, and this would be misleading. A case definition is not the same as a clinical diagnosis. Case definitions are an aid to conducting an epidemiologic investigation, whereas a clinical diagnosis is used to make treatment decisions for individual patients.
How specific should the definition be? Sometimes investigators will use a loose definition early on to help them identity the extent of the problem. However, once the investigators progress to the stage of conducting analytic studies to test their hypotheses, a more specific definition should be used in order to reduce misclassification which would bias the results.
For a nice overview on how to formulate case definitions, see the page on this topic in the module on Outbreak Investigations."
- An additional resource:: Link to CDC Case Definitions
The Line Listing
Bartow continues,
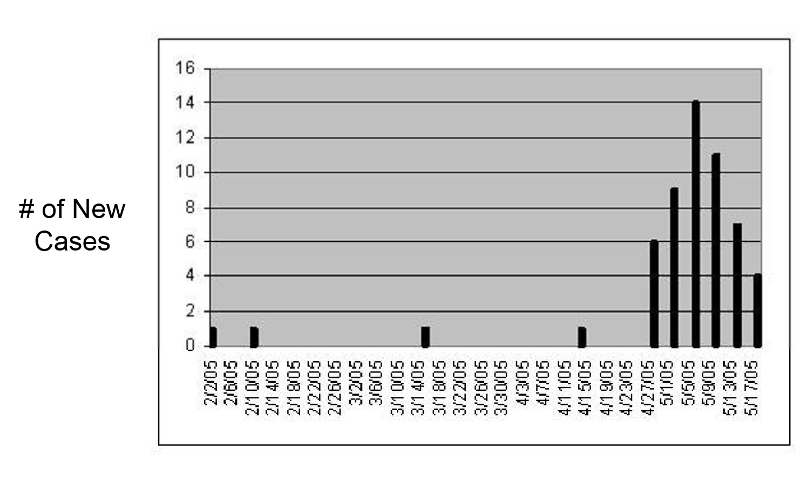
"In addition to using the MAVEN system for reportable infectious diseases, we also use an Excel spreadsheet to record the data on cases with reportable diseases in our community. Each case is listed on a separate row. This is called a 'Line Listing. With the data in a line listing like this, we can also use Excel to create an epidemic curve. An epidemic curve basically summarizes the onset of new cases of disease over time, and it can be very useful in giving you some important clues about the source of an outbreak. Here is a link to our current spreadsheet with our line listing.
If you aren't familiar with Excel or if you don't know how to create an epidemic curve, you can go to the module on Descriptive Epidemiology, which has two short videos that illustrate simple methods for creating an epidemic curve in Excel. The Excel file called Epi_Tools.XLSX also has two worksheet that illustrate how to do this quite easily. Check these out, and then see if you can use the information in the Initial Line Listing to create an epidemic curve from the Initial Line Listing file."
Did your epidemic curve look something like this? If not, you better go back and try again. The ability to create these graphs accurately is an important skill for you to develop. It will come in handy in a variety of circumstances


What Type of Epidemic Curve?
Epidemic curves tell you more than just whether or not there is an outbreak. Take another look at our epidemic curve. Note that the number of cases rises very quickly, peaks, and then begins to fall off. Also, so far all of the cases are contained within a single incubation period. Also bear in mind that the average incubation period is about 28 days, with a range of 15-50 days.
Take a quick look at this link to a concise description of the three main types of epidemic curves.
Tips on Interpreting Epidemic Curves
- Outliers may be informative. An early case may be unrelated to the outbreak, may be the source of the epidemic (such as an infected food handler) or a person who was exposed early. Late cases may also be unrelated, but they may also be secondary cases or persons exposed later than most.
- Consider the overall shape of the epidemic curve. The shape will be determined by the incubation period and whether it is a common source versus propagated epidemic.
- Find the peak of the outbreak and count back on the time axis one incubation period. Also identify the earliest case in the outbreak and count back the minimum incubation period. If these dates are at all close, they may identify the time period during which the cases became exposed.
- In a point source epidemic with a known disease, you can use the epidemic curve to calculate a likely period of exposure. This provides two advantages:
- You can identify the likely period of exposure, and this will help with directing questions to the cases about possible exposures.
- It may point to the index case.
- If the causative organism has not yet been identified, the epidemic curve may help by enabling you to calculate the incubation period.
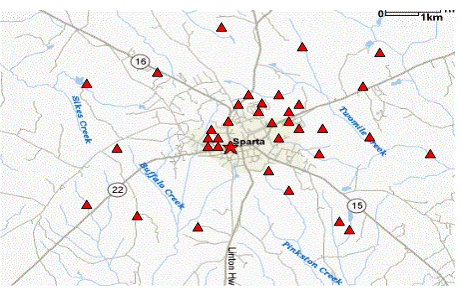
Location of the Cases (Spot Map)
Person, place, and time are the three characteristics one focuses on in descriptive epidemiology. The line listing gives us some information about person, and the epidemic curve gives us a visual sense of how the outbreak evolved over time. Given what we know about the biology and epidemiology of hepatitis A, the information suggests a point source, possibly contaminated food or an infected food handler.
The spot map below focuses on "place" by showing where each of the known cases lives. The cases are clustered somewhat more densely in the center of Sparta, but they are fairly scattered and do not suggest a specific location. So, in this case, the spot map by itself does not help pin down the source. These cases could have been exposed to a common source, such as an infected food handler, but they also could have been infected during foreign travel. For example, they might have been a group of residents from a church or school recently returned from a trip to South America.
Hypothesis-Generating Interviews
Hypothesis-generating interviews are preliminary interviews conducted with a limited number of cases (perhaps 8-10) in order to identify possible sources of exposure to the infectious agent. The cases should be typical cases drawn from a representative sample of the population (e.g. not all one race, gender, or age group), and the interviews should ideally be conducted by a single investigator. Before conducting interviews, the investigator should review the features of the disease and consider likely sources based on the biology of the disease (e.g. known modes of transmission) and information from past outbreaks. The interview should explore exposures during a specific time period, based on the onset of disease and the know incubation period; this focuses the interview on the period during which exposure was likely to have occurred. The information gathered usually includes basic demographic information (age, gender, residence, occupation), clinical details (date of onset, duration of disease), and many questions regarding possible exposures (contact with other ill persons, food history, water exposures, exposure to animals, travel, occupational exposures, hobbies, etc.). The conversation should be open-ended and wide-ranging and not strictly confined to well-established sources of disease or modes of transmission. In difficult investigations with few clues investigators have sometimes gathered several cases together to discuss possible common exposures. In other cases investigators have found it useful to visit the homes of the cases and look through their refrigerators and food shelves for clues.
After reviewing these brief interviews, indicate what hypothesis you have come up with regarding the source of the outbreak
|
Jillian Grey, Elementary School Teacher (1:33)
|
Richard Martin, Father of 8 Children, (5 with hepatitis) (2:50)
|
|
Peter Drew, Beer Distributor (2:05)
|
Emily Shultz, Student (and aspiring epidemiologist) (1:44)
|
Helpful Resources for developing a questionnaire, conducting an interview, and formulating a hypothesis:
- UNC Focus Article: Developing a Questionnaire
- Tips on Interviewing Cases
- UNC Focus Article: Hypothesis Generating Interviews
Hypothesis Generation
 In reality one begins to form hypotheses as soon as information about the outbreak begins to emerge. If you know what the disease is, your hypotheses will take into account its biology, what the reservoirs of disease are, how it is usually transmitted, its known risk factors, and its incubation period. In addition, descriptive epidemiology attempts to identify similarities in person, time, or place that may suggest hypotheses regarding the cause of the outbreak. For example, an epidemic curve illustrates the number of cases that occurred over time; it helps establish that there is an outbreak, and the shape of the curve may also suggest the nature of the source (e.g. isolated point source versus continuous common source).
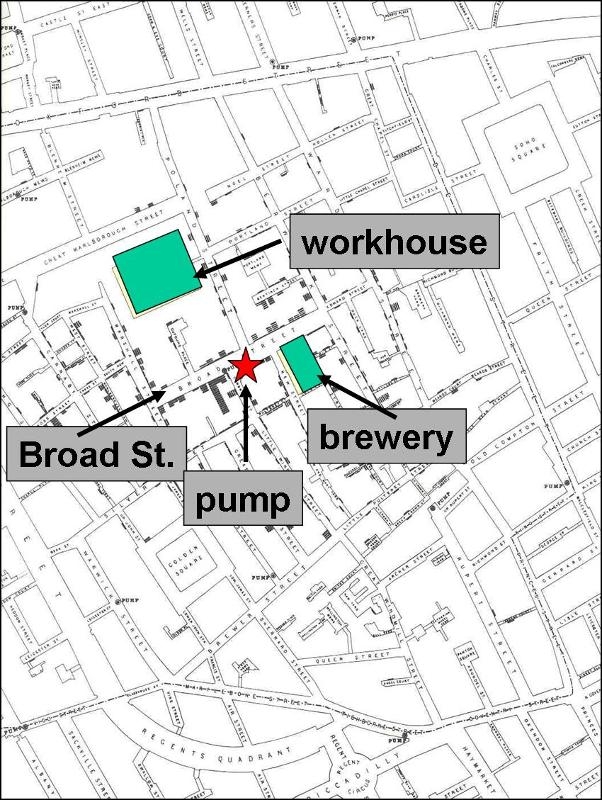
Spot maps can be used to illustrate the residence or work place of each of the cases that may suggest the source, such as John Snow's map (shown on the right) of cholera cases in London in 1852 clustered around the Broad St. pump.
Similarities in personal characteristics may also suggest the cause (e.g. common occupations, age, school attended, etc). Descriptive epidemiology focuses entirely on similarities among the cases and does not establish the cause. Hypotheses that are generated need to be tested by analytic studies that compare two or more groups of people (e.g. cases and controls who did not get the disease).
Putting It All Together
Now let's put the information we have so far together. The epidemic curve for the Sparta rises very quickly, peaks, and then begins to fall off. Also bear in mind that the average incubation period for hepatitis A is about 28 days, with a range of 15 to 50 days. So far all of the cases are contained within a single incubation period. Also, consider the preliminary information in the line listing, specifically the ages of the cases. We know that hepatitis A is transmitted via the fecal-oral route, that is, virus particles in the stool of an infected person somehow get ingested. This can occur as a result of travel to a developing country with suboptimal sanitation, sexual contact (especially MSM), in a child day-care setting where fecal contamination and children putting things into their mouths are common elements, or when food is contaminated, e.g., by an infected food handler.
