Gantt Charts as Planning Tools
What are Gantt Charts?
Henry Gantt, an American mechanical engineer and management consultant (1861 – 1919), invented and gave his name to this very powerful tool. Gantt charts illustrate the start and finish dates of terminal elements, smaller more intricate tasks that need to be completed as part of a larger task, and summary elements, which are those terminal elements that form the larger task of a project. For example a summary element for a car manufacturer would be to paint the vehicle, while the terminal elements would include priming the vehicle, applying multiple layers of paint, and then to wash, wax and buff the new paint job. The terminal elements and summary elements comprise the work breakdown structure of a project.
Watch the video below for an overview of Gantt charts provided by Easy Projects.
Examples of Gantt Charts
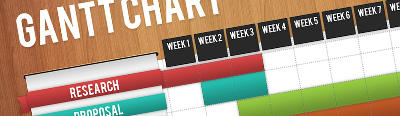
The image slider below highlights some examples of different Gantt charts.


. It highlights the division of labor as well as time horizon since milestones are indicated by date.")
 which are to be expended during the project period.")
How to Make a Gantt Chart
Below is list highlighting some video tutorials for making Gantt charts.
- How to draw a Gantt Chart: One important feature of a Gantt Chart is what are called Predecessor Events. These are activities that need to take place before a subsequent event can be initiated. This video demonstrates how a Gantt chart is developed based on these predecessor events.
- How to draw a Gantt Chart with more complicated predecessors: This video builds on the previous explaining how to address more complicated predecessors in a Gantt chart.
- Create a Basic Gantt Chart in Excel: While some more advanced Gantt charting tools are available, this video overviews how it is relatively easy to create a Gantt Chart in Excel.
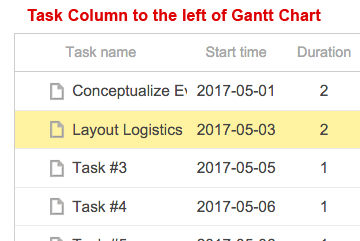
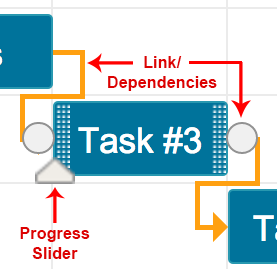
Now that you are familiar with how to make a Gantt Chart, let's use the example of planning a surprise birthday party to complete the following activity. Below is an interactive Gantt chart in which you will be filling out the necessary tasks and setting the duration and any links/dependencies from one task to the other. Before beginning this activity, review these interactive Gantt Chart instructions.
Advantages and Disadvantages of Gantt Charts
Advantages:
- Showing someone a plan can improve communications. People can better understand a plan that is drawn out. On a larger more complicated project, people can also better see their part of it and where it fits in.
- Resource Planning: The tasks can help identify the required resources. The graph can include this budget.
- Monitoring the progress: Allows one to analyze the progress, bottlenecks and insert more steps.
Disadvantages:
- Charts tend to become out of control when there are too many activities
- They don't clearly show the predecessor logic. For example if two activities (A and B) both ended on day 5 then you would not be able to determine if activity C depended on A or B or both of them...
- Doesn't clearly show the impacts of delayed activity
Software Supporting PM Tools
There are a host of different project scheduling tools available. Some of these are software based and some are better described as a method or approach. They vary in terms of ease of use, licensing costs and complexity. Some are more flexible than others and some you may have heard of and used for other purposes. You can click on links to learn more about each of these.