Descriptive Epidemiology
The image above illustrates the ten essential functions of public health. Epidemiology plays a particularly important role for three of the functions: monitoring, investigating, and evaluating. The 10 Essential Public Health Services describe the public health activities that all communities should undertake. Public health systems should
Disease surveillance systems and health data sources provide the raw information necessary to monitor trends in health and disease. Descriptive epidemiology provides a way of organizing and analyzing these data in order to understand variations in disease frequency geographically and over time, and how disease (or health) varies among people based on a host of personal characteristics (person, place, and time). This makes it possible to identify trends in health and disease and also provides a means of planning resources for populations. In addition, descriptive epidemiology is important for generating hypotheses (possible explanations) about the determinants of health and disease. By generating hypotheses, descriptive epidemiology also provides the starting point for analytic epidemiology, which formally tests associations between potential determinants and health or disease outcomes. Specific tasks of descriptive epidemiology are the following:
After successfully completing this unit, the student will be able to:

Descriptive epidemiology searches for patterns by examining characteristics of person, place, & time. These characteristics are carefully considered when a disease outbreak occurs, because they provide important clues regarding the source of the outbreak.
Hypotheses about the determinants of disease arise from considering the characteristics of person, place, and time and looking for differences, similarities, and correlations. Consider the following examples:
Descriptive epidemiology provides a way of organizing and analyzing data on health and disease in order to understand variations in disease frequency geographically and over time and how disease varies among people based on a host of personal characteristics (person, place, and time). Epidemiology had its origins in the desire to understand the determinants of acute infectious diseases, but its methods and applicability have expanded to include chronic diseases as well.
Outbreaks generally come to the attention of state or local health departments in one of two ways:
Clues About the Source of an Outbreak of Infectious Disease
When an outbreak occurs, one of the first things that should be considered is what is known about that particular disease. How can the disease be transmitted? In what settings is it commonly found? What is the incubation period? There are many good summaries available online. For example, Massachusetts DPH provides this link to a PDF fact sheet for Hepatitis A, which provide a very succinct summary. With this background information in mind, the initial task is to begin to characterize the cases in terms of personal characteristics, location, and time (when did they become ill and where might they have been exposed given the incubation period for that disease. In sense, we are looking for the common element that explains why all of these people became ill. What do they have in common?
Information about the cases is typically recorded in a "line listing," a grid on which information for each case is summarized with a separate column for each variable. Demographic information is always relevant, e.g., age, sex, and address, because they are often the characteristics most strongly related to exposure and to the risk of disease. In the beginning of an investigation a small number of cases will be interviewed to look for some common link. These are referred to as "hypothesis-generating interviews." Depending on the means by which the disease is generally transmitted, the investigator might also want to know about other personal characteristics, such as travel, occupation, leisure activities, use of medications, tobacco, drugs. What did these victims have in common? Where did they do their grocery shopping? What restaurants had they gone to in the past month or so? Had they traveled? Had they been exposed to other people who had been ill? Other characteristics will be more specific to the disease under investigation and the setting of the outbreak. For example, if you were investigating an outbreak of hepatitis B, you should consider the usual high-risk exposures for that infection, such as intravenous drug use, sexual contacts, and health care employment. Of course, with an outbreak of foodborne illness (such as hepatitis A), it would be important to ask many questions about possible food exposures. Where do you generally eat your meals? Do you ever eat at restaurants or obtain foods from sources outside the home? Hypothesis generating interviews may quickly reveal some commonalities that provide clues about the possible sources.
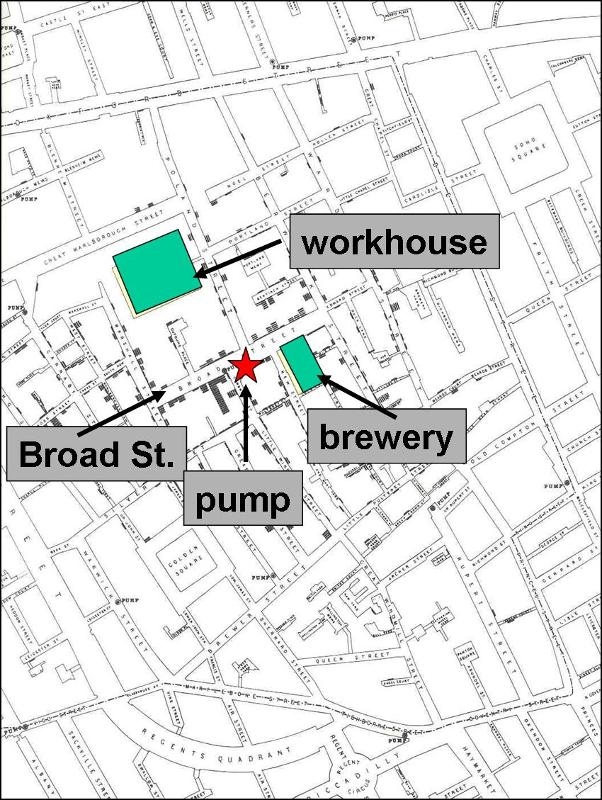
Assessment of an outbreak by place provides information on the geographic extent of a problem and may also show clusters or patterns that provide clues to the identity and origins of the problem. A simple and useful technique for looking at geographic patterns is to plot, on a "spot map" of the area, where the affected people live, work, or may have been exposed. A spot map of cases may show clusters or patterns that reflect water supplies, wind currents, or proximity to a restaurant or grocery store.
In 1854 there was an epidemic of cholera in the Broad Street area of London. John Snow determined the residence or place of business of the victims and plotted them on a street map (the stacked black disks on the map below). He noted that the cases were clustered around the Broad Street community pump. It was also noteworthy that there were large numbers of workers in a local workhouse and a brewery, but none of these workers were affected - the workhouse and brewery each had their own well.
On a spot map within a hospital, nursing home, or other such facility, clustering usually indicates either a focal source or person-to-person spread, while the scattering of cases throughout a facility is more consistent with a common source such as a dining hall. In studying an outbreak of surgical wound infections in a hospital, we might plot cases by operating room, recovery room, and ward room to look for clustering.
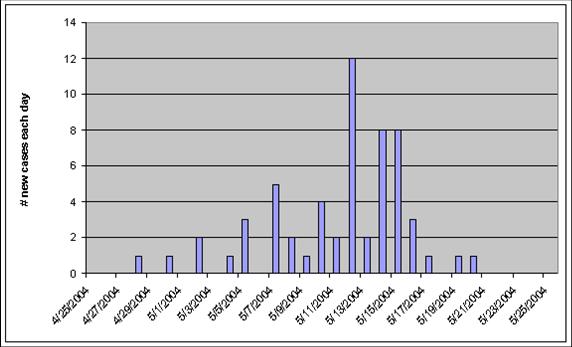
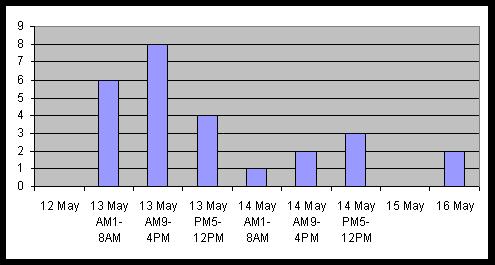
When investigating the source of an outbreak of infectious disease, Investigators record the date of onset of disease for each of the victims and then plot the onset of new cases over time to create what is referred to as an epidemic curve. The epidemic curve for an outbreak of hepatitis A is shown in the illustration below. Begriming in late April, the number of new cases rises to a peak of twelve new cases reported on May 12, and then the number of new cases gradually drops back to zero by May 21. Knowing that the incubation period for hepatitis A averages about 28-30 days, the investigators concluded that this was a point source epidemic because the cluster of new cases all occurred within the span of a single incubation period (see explanation on the next page). This, in conjunction with other information, provided important clues that helped shape their hypotheses about the source of the outbreak.
Video Summary: Person, Place, and Time (10:42)
An "epidemic curve" shows the frequency of new cases over time based on the date of onset of disease. The shape of the curve in relation to the incubation period for a particular disease can give clues about the source. There are three basic types of epidemic curve.
Point source outbreaks (epidemics) involve a common source, such as contaminated food or an infected food handler, and all the exposures tend to occur in a relatively brief period. Consequently, point source outbreaks tend to have epidemic curves with a rapid increase in cases followed by a somewhat slower decline, and all of the cases tend to fall within one incubation period. The graph above from a hepatitis outbreak is an example of a point source epidemic. The incubation period for hepatitis ranges from 15-50 days, with an average of about 28-30 days. In a point source epidemic of hepatitis A you would expect the rise and fall of new cases to occur within about a 30 day span of time, which is what is seen in the graph below.
Continuous common source epidemics may also rise to a peak and then fall, but the cases do not all occur within the span of a single incubation period. This implies that there is an ongoing source of contamination. The down slope of the curve may be very sharp if the common source is removed or gradual if the outbreak is allowed to exhaust itself. The epidemic curve below is from the cholera outbreak in the Broad Street area of London in 1854 that was investigated by Dr. John Snow. Cholera has an incubation period of 1-3 days, and even though residents began to flee when the outbreak erupted, you can see that this outbreak lasted for more than a single incubation period. This suggests an ongoing source of infection, in this case the Broad Street pump.
Propagated (or progressive source) epidemic. The epidemic curve shown below is from an outbreak of measles that began with a single index case who infected a number of other individuals. (The incubation period for measles averages 10 days with a range of 7-18 days.) One or more of the people infected in the initial wave infected a group of people who become the second wave of infection. So here transmission is person-to-person, rather than from a common source. Propagated epidemic curves usually have a series of successively larger peaks, which are one incubation period apart. The successive waves tend to involve more and more people, until the pool of susceptible people is exhausted or control measures are implemented. This is an ideal example, however; in reality, most of these epidemics do not produce the classic pattern.
For some outbreaks the descriptive information is all that is needed to figure out the source, and control measures can be undertaken rapidly. In other cases, this descriptive information (person, place, and time) helps generate hypotheses about the source, but it isn't obvious what the source is. When this occurs, it is necessary to test the hypotheses by conducting an analytical study, i.e. either a case-control study or a cohort study. This means collecting data and analyzing it in order to identify the source. After the hepatitis outbreak in Marshfield, DPH conducted a case-control study. After an outbreak of Giardia in Milton, MA, a retrospective cohort study was conducted. However, it is important to recognize that you can't test a hypothesis unless you have one to test. So, the descriptive studies that generate hypotheses are essential.
Use the graph below to answer this "Quiz Me."


Method 1 - video
Method 2 - video
Most outbreak investigations involve the following steps:
Some of these steps may be conducted simultaneously, and the order may vary depending on the circumstances. For example, if new cases are continuing to occur and there are steps that can be taken to control the outbreak and prevent more cases, then certainly control and prevention measures would take top priority.
General Information on Outbreak Investigations
For an overview of outbreak investigations for foodborne illness see the CDC web page linked here. Other good general sources of information on how to conduct outbreak investigations can be found in the University of North Carolina (UNC) online Focus on Field Epidemiology series. The following links to online articles may be of interest:
Volume 1
Issue #1: Overview of Outbreak Investigations
Issue #2: Anatomy and Physiology of an Outbreak Team
Issue #3: Embarking on an Outbreak Investigation
Issue #4: Case Finding and Line Listing: A Guide for Investigators
Issue #5: Epidemic Curves Ahead with a Focus Flash on Creating an Epidemic Curve in Excel
Issue #6:Hypothesis Generation During Outbreaks
Volume 2:
Issue #1: Hypothesis-Generating Interviews
Issue #2: Developing a Questionnaire
Issue #3: Interviewing Techniques
Another good general resource is "Hepatitis in Sparta." This is an online interactive teaching case that thrusts the student into the role of investigator trying to determine the source for an outbreak of hepatitis cases in the town of Sparta.
The same questions about person, time, and place can be applied to chronic diseases. Who are the people who have the disease? What are their characteristics? What is their occupation? Where do they live and work? How did disease occurrence vary over time?
Personal characteristics also provide clues about the causes of chronic diseases. Many disease vary in relation to age and gender, but many other characteristics are also important, such as occupation, diet, sexual activity, travel history, and personal behaviors (exercise, smoking, etc.)
Age-specific Rates of Disease
Because so many diseases vary in relation to disease, one frequently sees disease rates categorized this way - so-called "age-specific rates of disease." Mortality rates are very low in the youngest age groups & similar in males and females. In adulthood the mortality rates rise sharply and become higher in males. Although the mortality rate continues to rise into old age, the gender difference begins to narrow. One might describe this as a chronic, progressive disease in which the gender differences raise the question of whether sex hormones play a role, particularly since females begin to catch up after menopause occurs.
Table - Death Rates from Coronary Artery Disease (Age-Specific Rates)
|
Age Group (years) |
Males |
Females |
|---|---|---|
|
5-14 |
0.9 |
0.8 |
|
15-24 |
2.6 |
1.6 |
|
25-34 |
9.4 |
4.2 |
|
35-44 |
60.6 |
16.2 |
|
45-54 |
265.6 |
71.2 |
|
55-64 |
708.7 |
243.7 |
|
65-74 |
1670.0 |
769.4 |
|
75-84 |
3751.5 |
2359.0 |
|
85+ |
8596.0 |
7215.1 |
Differences by Race and Ethnicity
In addition to age and gender one might want to examine how disease rates differ with respect to other characteristics, such as race. The table below summarizes. annual mortality rates per 100,000 in whites and blacks in the United States in 1967. Ethnic and racial differences in disease rates sometimes have a genetic basis, e.g., sickle cell anemia in people of African descent or beta thalassemia in people of Mediterranean descent, but in other cases racial differences are due to environmental or socioeconomic factors.
Table - Annual Mortality Rates per 100,000 population in the US, 1967
|
Cause |
White |
Non-White |
|---|---|---|
|
Homicide |
3.5 |
32.3 |
|
Tuberculosis |
2.5 |
9.6 |
|
Hypertensive heart disease |
21.1 |
68.6 |
|
Diabetes mellitus |
16.6 |
28.9 |
|
Pneumonia |
26.0 |
42.4 |
|
Non-motor vehicle accidents |
28.6 |
43.9 |
|
Motor vehicle accidents |
26.5 |
29.8 |
|
Cirrhosis of liver |
13.2 |
19.9 |
|
Respiratory cancer |
28.9 |
29.8 |
|
Leukemia |
7.4 |
5.5 |
Other Personal Characteristics
Besides age, gender and race/ethnicity, other personal characteristics that might be important to consider are:
Differences in disease frequency by location provides important clues about the determinants of chronic diseases. Where does the disease tend to occur?
Example 1: Stomach Cancer by Location in the US
These maps show death rates from stomach cancer in females (top) and males (below) in different US counties. The darkness of shading of each county indicates how its stomach cancer rate compares with the national average. The darkest shading indicates rates well above average, and white shading indicates rates below average; the gray shading indicates intermediate levels. Note that rates of stomach cancer tend to be high in counties in the north-central part of the country in both males and females. Investigators speculated that these clusters might correlate with populations of German or Scandinavian descent who have a tradition of eating smoked fish. Could the high rates of stomach cancer be the result of their consumption of smoked fish or other traditional methods of food preservation?
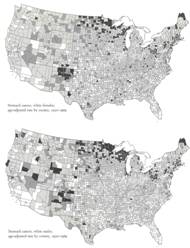
Source: Atlas of Cancer Mortality for U.S. Counties: 1950-1969, TJ Mason et al, PHS, NIH, 1975
Example 2: Differences in Rates of Stomach Cancer in Japan and US
Rates of stomach cancer also vary among countries. Japanese have a higher rate of stomach cancer than Caucasians in California. Is this due to a genetic difference? A dietary difference? The rate among Japanese people diminishes after they move to US, and diminishes even more in their offspring. One possibility is that once the Japanese move here, they begin to shift to an American diet, and this trend is even stronger in their children. Are there important dietary differences? Could consumption of large amounts of smoked fish be a cause of stomach cancer?
|
Population |
Mortality Rate (per 100,000 population) |
|---|---|
|
Japanese in Japan |
58.4 |
|
Japanese immigrants to California |
29.9 |
|
Sons of Japanese immigrants |
11.7 |
|
Native Californians (Caucasians) |
8.0 |
Changes in disease rate over time can also provide clues for chronic diseases.
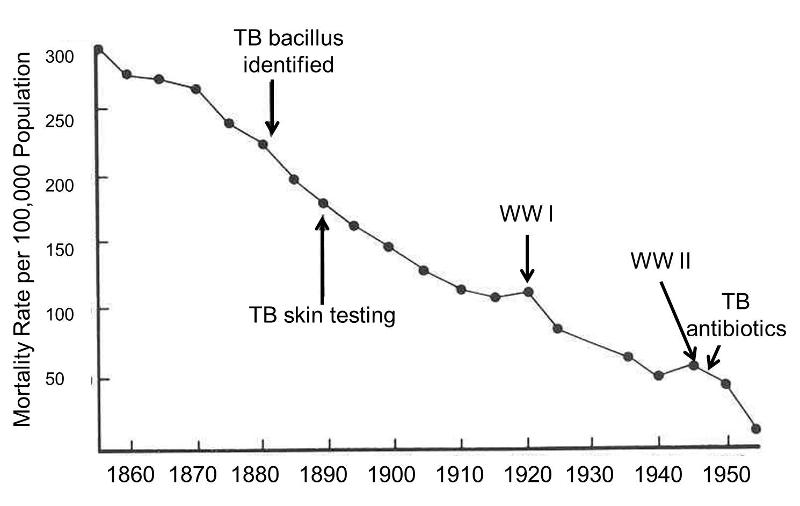
Example 1: Annual Mortality from Pulmonary Tuberculosis in England and Wales
Tuberculosis (TB) is one of the great killers of all times. The graph on the right shows the mortality rate from TB from 1855-1955 in England and Wales. The remarkable downward trend began well before the development of antibiotics. The steady improvement was probably a direct result of "the sanitary idea" which resulted in concerted efforts to improve working and living conditions, nutrition, ventilation, and waste management. Also, note the increases in TB mortality that occurred during World War I and World War II. This suggests that nutritional deficiencies, translocation, crowding, and other adverse circumstances associated with war are contributing factors to the causation of TB.
Example 2: Toxic Shock and Rely Tampons
In January 1980 there were several reports of toxic shock syndrome due to infection with Staphylococcus aureus bacteria, and the descriptive epidemiology indicated that the problem was occurring primarily in menstruating women. A CDC task force investigated and eventually traced the outbreak to the introduction of Rely tampons, a super absorbent product marketed by Proctor and Gamble. The monthly cases of toxic shock syndrome in 1980-1981 are shown in the graph below [from A. Reingold et al., Toxic shock syndrome surveillance in the United States, 1980-1981. Ann. Intern. Med 96:875, 1982]. The graph shows that prior to 1978 there were just occasional cases of toxic shock syndrome in the United States. After Rely tampons were introduced in 1978, there was a steady increase in toxic shock cases which peaked at about 125 per month in 1980. Shortly after that, Rely tampons were taken off the market, and the incidence declined sharply.
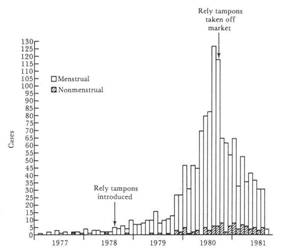
There were actual two pieces of evidence related to time variations that supported Rely tampons as the cause. First, descriptive epidemiology suggested a link to menstruation, leading doctors to take bacterial cultures from the vagina. This provided a key clue suggesting a link to certain brands of tampons. In addition, the frequency of toxic shock syndrome clearly correlated with the introduction and subsequent removal of Rely tampons from the market.
Other Factors That Can Produce Changes in Disease Frequency Over Years or Decades
If the frequency of a disease or mortality from a disease changes over time, there are several factors which could be responsible:
Specifying the research questions is essential to selection of an appropriate study population, and infinite questions exist. Nevertheless, Keyes and Galea stress two fundamental types of research questions which have important implications selecting an appropriate study design.
These are:
Examples:
Questions like these require samples that are representative of the population being studied, that is comparable to the population in their characteristics (and they require adequate sample size in order to minimize sampling error).
Examples:
Questions like these also require an adequate sample size to precisely assess the magnitude of an effect, but they differ from questions aimed at parameter estimation in that that they require making comparisons, e.g., comparing risk between exposed and non-exposed persons. When trying to answer questions like these regarding etiology, it is not so important that the samples be representative of the overall population, but for accurate assessment of the effect the groups being compared must be comparable to each other with respect to other factors that affect the outcome.
Keyes and Galea identify three fundamental approaches to study design that can be applied regardless of whether one's goal is to take representative samples to estimate population parameters or to take purposive samples in order to determine whether a given exposure or factor causes one or more health outcomes.
The second option will only be utilized in analytical studies, which will be covered in a separate module, but the first two options will be seen in the next section describing several types of descritive studies.
A case report is a detailed description of disease occurrence in a single person. Unusual features of the case may suggest a new hypothesis about the causes or mechanisms of disease.
Example: Acquired Immunodeficiency in an Infant; Possible Transmission by Means of Blood Products
Link to article by Ammann AJ et al: Acquired immunodeficiency in an infant: possible transmission by means of blood products. The Lancet 1:956-958, 1983.
In April 1983 it had not yet been shown that AIDS could be transmitted by blood or blood products. An infant born with Rh incompatibility; required blood products from 18 donors over 8 weeks and subsequently developed unusual recurrent infections with opportunistic agents such as Candida. The infant's T cell count was low, suggesting AIDS. There was no family history of immunodeficiency, but one of the blood donors was found to have died of AIDS. This led the investigators to hypothesize that AIDS could be transmitted by blood transfusion.
Example: Survival after Treatment of Rabies with Induction of Coma.
Link to article by Willoughby R, Jr., et al: N Engl J Med 2005;352:2508-14.
Rabies is almost uniformly fatal once it develops. As of 2005 there had been only four survivors, each of whom received rabies prophylaxis after the bite, but before symptoms developed. Willoughby et al. reported on a 15 year-old girl who rescued and released a bat that had struck an interior window. The bat bit her left index finger. The wound was washed with peroxide, but medical attention was not sought, and no rabies prophylaxis was administered. One month later she began to experience progressive neurological symptoms that were eventually diagnosed as rabies. The mainstay of her treatment was medically induced coma. Eight days later blood tests demonstrated that she had begun to develop an immune response to the rabies virus. Eventually the coma was reversed, and the patient gradually regained consciousness. She had severe neurological deficits, but gradually improved. She was discharged to her home after 76 days. Five months after her initial hospitalization, she was alert and communicative, but had persistent slurred speech and an unsteady gait.
The report by Willoughby et al. is an example of a case report – a detailed description of a single subject. The report is important because it demonstrates that it is possible for victims of rabies to survive, even without post-exposure prophylaxis. However, we have no idea how effective this treatment might be.
A case series is a report on the characteristics of a group of subjects who all have a particular disease or condition. Common features among the group may suggest hypotheses about disease causation. Note that the "series" may be small (as in the example below) or it may be large (hundreds or thousands of "cases"). However, the chief limitation is that there is no comparison group. Consequently, common features may suggest hypotheses, but these need to be tested with some sort of analytical study before an association can be accepted as valid.
Example: Pneumocystis carinii pneumonia and mucosal candidiasis in previously healthy homosexual men: evidence of a new acquired cellular immunodeficiency.
Link to article by Gottlieb MS, et al: N Engl J Med 1981;305:1425-1431.

In 1980 –1981 four previously healthy young men were diagnosed with Pneumocystis carinii pneumonia, an unusual "opportunistic" infection that had only been seen in immune compromised people with hereditary disorders or in people with immune compromise due to chemotherapy. The medical histories didn't suggest any preexisting immunodeficiency, but all had decreased immune responses and low T cell counts. These unusual infections suggested the possibility of a previously unknown disease. It was noted that all four men were sexually active homosexuals, and in the case series which was published in the New England Journal of Medicine the authors speculated that the immune dysfunction was due to a sexually transmitted infectious agent.
This was an extraordinarily important case series (a detailed description of characteristics of a series of people who all have the same disease) that suggested that this new syndrome was associated with sexual activity in male homosexuals. Alerting the medical establishment and proposing a hypothesis was an important milestone in the AIDS epidemic, however, the association could not be securely established based on this small case series. It was not known how many other individuals might be suffering from this new syndrome. It was also not known what the prevalence of homosexuality might be in others with this syndrome or how this might compare to the overall prevalence of homosexuality in the population that gave rise to the cases. As a result, this case series could not securely establish a valid association. Nevertheless, it laid the ground work for subsequent case-control studies and cohort studies (analytic studies) that did establish the risk factors for this disease.
Example: Oral Contraceptives and Hepatocellular Carcinoma?
There had been a number of case reports of liver cancers in young women taking oral contraceptives. A study was undertaken by contacting all of the cancer registries collaborating with the American College of Surgeons. The investigators wanted to collect information on as many of these rare liver tumors as possible across the US.
Table - Oral Contraceptive Use Among Women Who Developed Liver Cancer
|
Oral Contraceptive Use |
Age 16-25 yrs. |
Age 26-35 yrs. |
Age 36-45 yrs. |
|---|---|---|---|
|
Yes |
31% |
43% |
22% |
|
No |
20% |
10% |
29% |
|
Unknown |
49% |
48% |
49% |
What conclusions can you draw from these data regarding a possible increased risk of liver cancer in woman taking oral contraceptives? Think about it before you look at the answer.
Answer
|
|
Video Summary: Case Reports and Case Series (6:59)
Cross-sectional surveys assess the prevalence of disease and the prevalence of risk factors at the same point in time and provide a "snapshot" of diseases and risk factors simultaneously in a defined population. For example, US government agencies periodically send out large surveys to random samples of the US population, asking about health status and risk factors and behaviors at that point in time. The Health Interview Survey (HIS) and the National Health and Nutrition Examination Survey (NHANES) are good examples.
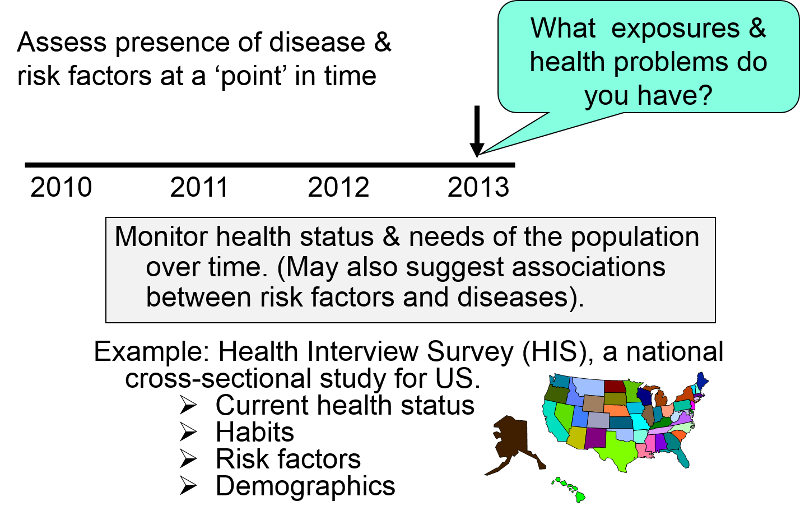
The health questionnaires you are asked to fill out when you go to a new physician or being processed for a new job, or prior to entry into military service are similar to cross-sectional surveys in that they ask about the health problems that you have (heart disease? diabetes? asthma?) and your current behaviors and risk factors (e.g., How old are you? Do you smoke? What is your occupation?).
Cross-sectional surveys ask people their current status with respect to both exposures and diseases. This results in two main disadvantages.
Consider the following example in which a survey was conducted among white male farm workers. The survey asked many questions, but among them were the questions: "Have you been told you have coronary heart disease (CHD)?" And "How would you classify your level of physical activity?" The table below summarizes the findings.
Table - Current Coronary Heart Disease Among Male Farm Workers
|
|
# of Respondents |
# Respondents With CHD |
Prevalence of CHD per 1,000 |
|---|---|---|---|
|
Currently Not Active |
89 |
14 |
157 |
|
Currently Physically Active |
90 |
3 |
38 |
Note that the investigators did not follow these subjects over a period of time, so they did not assess the "incidence" of heart disease. Instead, they asked the subjects questions designed to determine the prevalence of heart disease, i.e., the proportion of the study population that had heart disease at this particular point in time. When they divided the sample into physically active and inactive farmers and computed the prevalence of heart disease in each of these, they found that CHD was much more prevalent among the inactive farmers. However, this was a cross-sectional study that related the prevalence of disease to the prevalence of activity at a point in time. They did not follow subjects over time to track the development of heart disease (i.e., the incidence). Consequently, the temporal relationship between the risk factor of interest (physical inactivity) and the outcome (CHD) is unclear. Had the farmers been physically active prior to developing CHD? Or, did they begin to limit their physical activity after they developed CHD? Consequently physical inactivity could have been either a cause of heart disease, or it could have been a consequence of CHD.
Large cross-sectional surveys are important for monitoring health status and health care needs of the population over time, and they are sometimes useful for suggesting possible associations between risk factors and diseases. However, the temporal relationship between the risk factor and disease is frequently unclear. Under these circumstances, they can generate hypotheses, but these associations need to be tested by appropriate analytical studies.
However, note that under some circumstances, the temporal relationship is clear on a cross-sectional survey. For example, if one conducted a survey of salaries of male and female professors to see if gender was associated with salary inequities, we could regard this as an analytical study, because it is clear that gender was established long before salary level. In this situation the temporal relationship between the "exposure" of interest (gender) and outcome (salary paid) is clear; we know that gender was established before the salary was negotiated. So, in a sense cross-sectional studies (and ecological studies can be thought of as an intermediate category between descriptive and analytic studies.
Video Summary on Cross-Sectional Surveys (8:25)

These studies are distinguished by the fact that the unit of observation is not a person; rather it is an entire population or group. In essence, these studies examine the correlation between the average exposure in various populations with the overall frequency of disease within the populations.
In the study below investigators used commerce data to compute the overall consumption of meat by various nations. They then calculated the average (per capita) meat consumption per person by dividing total national meat consumption by the number of people in a given country. There is a clear linear trend; countries with the lowest meat consumption have the lowest rates of colon cancer, and the colon cancer rate among these countries progressively increases as meat consumption increases.
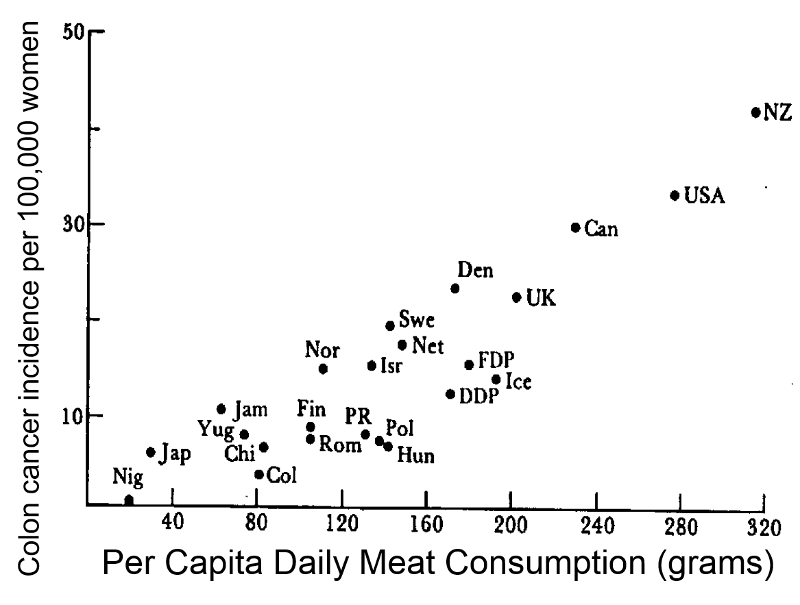
Note that in reality, people's meat consumption probably varied widely within nations, and the exposure that was calculated was an average that assumes that everyone ate the average amount of meat. This average exposure was then correlated with the overall disease frequency in each country. The example here suggests that the frequency of colon cancer increases as meat consumption increases. The characteristic of ecological studies that is most striking is that there is no information about individual people. If the data were summarized in a spread sheet, you would not see individual level data; you would see records with data on average exposure in multiple groups.
Morgenstern notes that, "Individual level variables are properties of individuals, and ecologic variables are properties of groups. To be more specific, ecologic measures may be classified into three types:
Morgenstern goes on to note: "Ecologic study designs may be classified on two dimensions: (a) whether the primary group is measured (exploratory vs analytic study); and (b) whether subjects are grouped by place (multiple-group study), by time (time-trend study), or by place and time (mixed study). Despite several practical advantages of ecologic studies, there are many methodologic problems that severely limit causal inference, including ecologic and cross-level bias, problems of confounder control, within-group misclassification, lack of adequate data, temporal ambiguity, collinearity, and migration across groups."
For a detailed review of ecologic studies see follow the link to an article by Morgenstern H: Ecologic Studies in Epidemiology: Concepts, Principles, and Methods. Annual Review of Public Health 1995;16:61-81.

To see an extraordinary example of an ecologic study, play the video below created by Hans Rosling. This is a magnificent example that examines the correlation between income and life expectancy in the countries of the world over time. It is also a terrific example of a creative, engaging, and powerful way to display a vast quantity of data.
Advantages of Ecological Studies:
Limitations of Ecological Studies: It is important to bear in mind that the exposure in correlational studies is the average exposure for an entire population or group. This results in major limitations:
When a correlational study compared per capita alcohol consumption to death rates from coronary heart disease in different countries, it appeared that there was a fairly striking negative correlation.
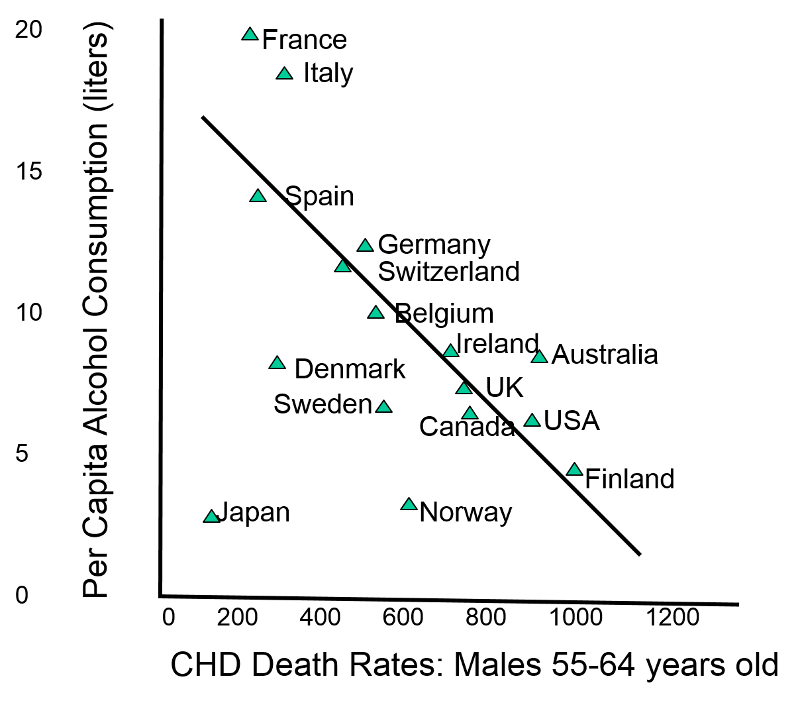
However, a meta-analysis of prospective cohort studies which determined mortality rates in subjects for whom they had estimates of individual alcohol consumption, showed that there was actually a "J" shaped relationship. The people who drank the most actually had the highest mortality rates; moderate drinkers had the lowest mortality. This relationship was masked in the correlational study, because of the small percentage of people who have more than three drinks per day.

Adapted from: Di Castelnuovo A, Costanzo S, et al.: Alcohol Dosing and Total Mortality in Men and Women:
An Updated Meta-analysis of 34 Prospective Studies. Arch Intern Med. 2006;166(22):2437-2445.
Video Summary for Ecological Studies (7:48)
Descriptive studies are useful for:
