
Overview of Analytic Studies
We search for the determinants of health outcomes, first, by relying on descriptive epidemiology to generate hypotheses about associations between exposures and outcomes. Analytic studies are then undertaken to test specific hypotheses. Samples of subjects are identified and information about exposure status and outcome is collected. The essence of an analytic study is that groups of subjects are compared in order to estimate the magnitude of association between exposures and outcomes.
In their book entitled "Epidemiology Matters" Katherine Keyes and Sandro Galea discuss three fundamental options for studying samples from a population as illustrated in the video below (duration 8:30).
After successfully completing this section, the student will be able to:
A cohort is a "group." In epidemiology a cohort is a group of individuals who are followed over a period of time, primarily to assess what happens to them, i.e., their health outcomes. In cohort type studies one identifies individuals who do not have the outcome of interest initially, and groups them in subsets that differ in their exposure to some factor, e.g., smokers and non-smokers. The different exposure groups are then followed over time in order to compare the incidence of health outcomes, such as lung cancer or heart disease. As an example, the Framingham Heart Study enrolled a cohort of 5,209 residents of Framingham, MA who were between the ages of 30-62 and who did not have cardiovascular disease when they were enrolled. These subjects differed from one another in many ways: whether they smoked, how much they smoked, body mass index, eating habits, exercise habits, gender, family history of heart disease, etc. The researchers assessed these and many other characteristics or "exposures" soon after the subjects had been enrolled and before any of them had developed cardiovascular disease. The many "baseline characteristics" were assessed in a number of ways including questionnaires, physical exams, laboratory tests, and imaging studies (e.g., x-rays). They then began "following" the cohort, meaning that they kept in contact with the subjects by phone, mail, or clinic visits in order to determine if and when any of the subjects developed any of the "outcomes of interest," such as myocardial infarction (heart attack), angina, congestive heart failure, stroke, diabetes and many other cardiovascular outcomes.
Over time some subjects eventually began to develop some of the outcomes of interest. Having followed the cohort in this fashion, it was eventually possible to use the information collected to evaluate many hypotheses about what characteristics were associated with an increased risk of heart disease. For example, if one hypothesized that smoking increased the risk of heart attacks, the subjects in the cohort could be sorted based on their smoking habits, and one could compare the subset of the cohort that smoked to the subset who had never smoked. For each such comparison that one wanted to make the cohort could be grouped according to whether they had a given exposure or not, and one could measure and compare the frequency of heart attacks (i.e., the incidence) between the groups. Incidence provides an estimate of risk, so if the incidence of heart attacks is 3 times greater in smokers compared to non-smokers, it suggests an association between smoking and risk of developing a heart attack. (Various biases might also be an explanation for an apparent association. We will learn about these later in the course.) The hallmark of analytical studies, then, is that they collect information about both exposure status and outcome status, and they compare groups to identify whether there appears to be an association or a link.
From the discussion above, it should be obvious that one of the basic requirements of a cohort type study is that none of the subjects have the outcome of interest at the beginning of the follow-up period, and time must pass in order to determine the frequency of developing the outcome.
Eligible subjects have to meet certain criteria to be included as subjects in a study (inclusion criteria). One of these would be that they did not have any of the diseases or conditions that the investigators want to study, i.e., the subjects must be "at risk," of developing the outcome of interest, and the members of the cohort to be followed are sometimes referred to as "the population at risk."
However, at times decisions about who is "at risk" and eligible get complicated.
Example #1: Suppose the outcome of interest is development of measles. There may be subjects who:
In this case the eligibility criteria would be shaped by the specific scientific questions being asked. One might want to compare subjects known to have had clinically apparent measles to those who had not had clinical measles and had not had a measles vaccination. Or, one could take blood sample from all potential subjects in order to measure their antibody titers (levels) to the measles virus.
Example #2: Suppose you are studying an event that can occur more that once, such as a heart attack. Again, the eligibility criteria should be shaped to fit the scientific questions that are being answered. If one were interested in the risk of a first myocardial infarction, then obviously subjects who had already had a heart attack would not be eligible for study. On the other hand, if one were interested in tertiary prevention of heart attacks, the study cohort would include people who had had heart attacks or other clinical manifestations of heart disease, and the outcome of interest would be subsequent significant cardiac events or death.
Cohort studies can be classified as prospective or retrospective based on when outcomes occurred in relation to the enrollment of the cohort.
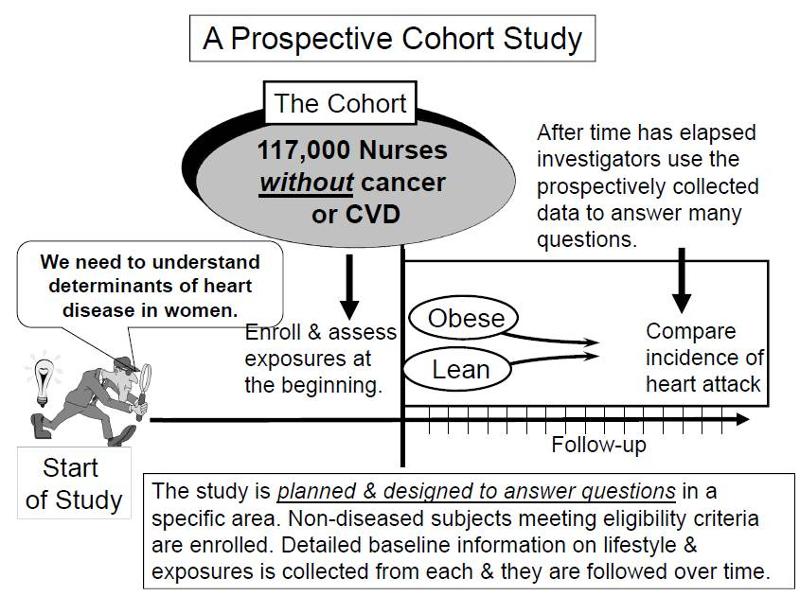
In a prospective study like the Nurses Health Study baseline information is collected from all subjects in the same way using exactly the same questions and data collection methods for all subjects. The investigators design the questions and data collection procedures carefully in order to obtain accurate information about exposures before disease develops in any of the subjects. After baseline information is collected, subjects in a prospective cohort study are then followed "longitudinally," i.e. over a period of time, usually for years, to determine if and when they become diseased and whether their exposure status changes. In this way, investigators can eventually use the data to answer many questions about the associations between "risk factors" and disease outcomes. For example, one could identify smokers and non-smokers at baseline and compare their subsequent incidence of developing heart disease. Alternatively, one could group subjects based on their body mass index (BMI) and compare their risk of developing heart disease or cancer.
|
Key Concept: The distinguishing feature of a prospective cohort study is that at the time that the investigators begin enrolling subjects and collecting baseline exposure information, none of the subjects has developed any of the outcomes of interest.
|
Examples of Prospective Cohort Studies
Pitfall: Note that in these prospective cohort studies a comparison of incidence between the groups can only take place after enough time has elapsed so that some subjects developed the outcomes of interest. Since the data analysis occurs after some outcomes have occurred, some students mistakenly would call this a retrospective study, but this is incorrect. The analysis always occurs after a certain number of events have taken place. The characteristic that distinguishes a study as prospective is that the subjects were enrolled, and baseline data was collected before any subjects developed an outcome of interest.
In contrast, retrospective studies are conceived after some people have already developed the outcomes of interest. The investigators jump back in time to identify a cohort of individuals at a point in time before they have developed the outcomes of interest, and they try to establish their exposure status at that point in time. They then determine whether the subject subsequently developed the outcome of interest.
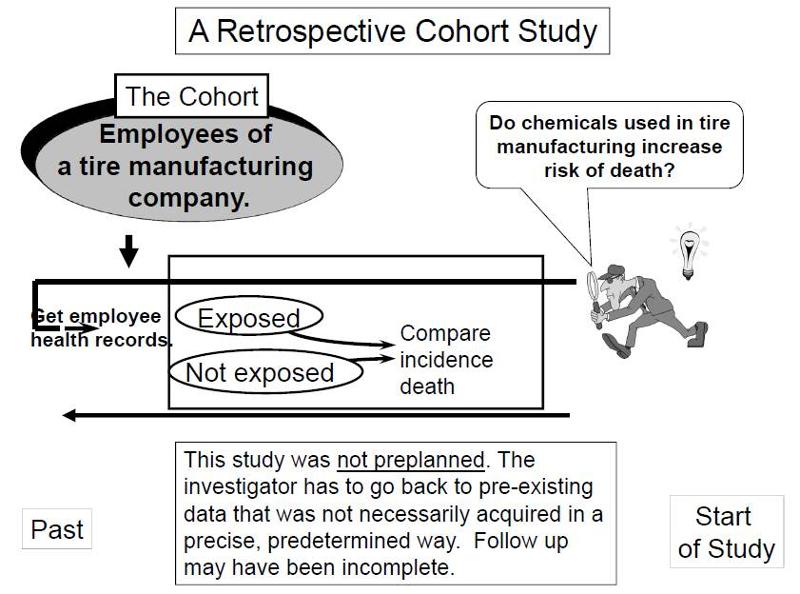
Suppose investigators wanted to test the hypothesis that working with the chemicals involved in tire manufacturing increases the risk of death. Since this is a fairly rare exposure, it would be advantageous to use a special exposure cohort such as employees of a large tire manufacturing factory. The employees who actually worked with chemicals used in the manufacturing process would be the exposed group, while clerical workers and management might constitute the "unexposed" group. However, rather than following these subjects for decades, it would be more efficient to use employee health and employment records over the past two or three decades as a source of data. In essence, the investigators are jumping back in time to identify the study cohort at a point in time before the outcome of interest (death) occurred. They can classify them as "exposed" or "unexposed" based on their employment records, and they can use a number of sources to determine subsequent outcome status, such as death (e.g., using health records, next of kin, National Death Index, etc.).
|
Key Concept: The distinguishing feature of a retrospective cohort study is that the investigators conceive the study and begin identifying and enrolling subjects after outcomes have already occurred. |
Retrospective cohort studies like the one described above are very efficient for studying rare or unusual exposures, but there are many potential problems here. Sometimes exposure status is not clear when it is necessary to go back in time and use whatever data is available, especially because the data being used was not designed to answer a health question. Even if it was clear who was exposed to tire manufacturing chemicals based on employee records, it would also be important to take into account (or adjust for) other differences that could have influenced mortality, i.e., confounding factors. For example, it might be important to know whether the subjects smoked, or drank, or what kind of diet they ate. However, it is unlikely that a retrospective cohort study would have accurate information on these many other risk factors.
The video below provides a brief (7:31) explanation of the distinction between retrospective and prospective cohort studies.
Link to a transcript of the video
Intervention studies (clinical trials) are experimental research studies that compare the effectiveness of medical treatments, management strategies, prevention strategies, and other medical or public health interventions. Their design is very similar to that of a prospective cohort study. However, in cohort studies exposure status is determined by genetics, self-selection, or life circumstances, and the investigators just observe differences in outcome between those who have a given exposure and those who do not. In clinical trials exposure status (the treatment type) is assigned by the investigators. Ideally, assignment of subjects to one of the comparison groups should be done randomly in order to produce equal distributions of potentially confounding factors. Sometimes a group receiving a new treatment is compared to an untreated group, or a group receiving a placebo or a sham treatment. Sometimes, a new treatment is compared to an untreated group or to a group receiving an established treatment. For more on this topic see the module on Intervention Studies.
In summary, the characteristic that distinguishes a clinical trial from a cohort study is that the investigator assigns the exposure status in a clinical trial, while subjects' genetics, behaviors, and life circumstances determine their exposures in a cohort study.
|
Key Concept: Common features of both prospective and retrospective cohort studies.
|
Investigators often use contingency tables to summarize data. In essence, the table is a matrix that displays the combinations of exposure and outcome status. If one were summarizing the results of a study with two possible exposure categories and two possible outcomes, one would use a "two by two" table in which the numbers in the four cells indicate the number of subjects within each of the 4 possible categories of risk and disease status.
For example, consider data from a retrospective cohort study conducted by the Massachusetts Department of Public Health (MDPH) during an investigation of an outbreak of Giardia lamblia in Milton, MA in 2003. The descriptive epidemiology indicated that almost all of the cases belonged to a country club in Milton. The club had an adult swimming pool and a wading pool for toddlers, and the investigators suspected that the outbreak may have occurred when an infected child with a dirty diaper contaminated the water in the kiddy pool. This hypothesis was tested by conducting a retrospective cohort study. The cases of Giardia lamblia had already occurred and had been reported to MDPH via the infectious disease surveillance system (for more information on surveillance, see the Surveillance module). The investigation focused on an obvious cohort - 479 members of the country club who agreed to answer the MDPH questionnaire. The questionnaire asked, among many other things, whether the subject had been exposed to the kiddy pool. The incidence of subsequent Giardia infection was then compared between subjects who been exposed to the kiddy pool and those who had not.
The table below summarizes the findings. A total of 479 subjects completed the questionnaire, and 124 of them indicated that they had been exposed to the kiddy pool. Of these, 16 subsequently developed Giardia infection, but 108 did not. Among the 355 subjects who denied kiddy pool exposure, 14 developed Giardia infection, and the other 341 did not.
|
Swam in Kiddy Pool? |
Giardia |
No Giardia |
Total |
Cumulative Incidence |
|
Yes |
16 |
108 |
124 |
16/124 = 12.9% |
|
No |
14 |
341 |
365 |
14/365 = 3,9% |
Organization of the data this way makes it easier to compute the cumulative incidence in each group (12.9% and 3.9% respectively). The incidence in each group provides an estimate of risk, and the groups can be compared in order to estimate the magnitude of association. (This will be addressed in much greater detail in the module on Measures of Association.) One way of quantifying the association is to calculate the relative risk, i.e., dividing the incidence in the exposed group by the incidence in the unexposed group). In this case, the risk ratio is (12.9% / 3.9%) = 3.3. This suggest that subjects who swam in the kiddy pool had 3.3 times the risk of getting Giardia infections compared to those who did not, suggesting that the kiddy pool was the source.
Unanswered Questions

If the kiddy pool was the source of contamination responsible for this outbreak, why was it that:
Before you look at the answer, think about it and try to come up with a possible explanation.
Likely Explanation
Optional Links of Potential Interest
Link to the 2003 Giardia outbreak
Link to CDC page on Organizing Data
Possible Pitfall: Contingency tables can be oriented in several ways, and this can cause confusion when calculating measures of association.
There is no standard rule about how to set up contingency tables, and you will see them set up in different ways.
If you aren't careful, these different orientations can result in errors in calculating measures of association. One way to avoid confusion is to always set up your contingency tables in the same way. For example, in these learning modules the contingency tables almost always indicate outcome status in columns listing subjects who have the outcome of interest to the left of subjects who do not have the outcome, and exposure status of the exposed (or most exposed) group is listed in a row above those who are unexposed (or have less exposure).
The table below illustrates this arrangement.
|
|
Those With the Outcome |
Those Without the Outcome |
Total |
|
Exposed (or most exposed) |
|
|
|
|
Non-exposed (or least exposed) |
|
|
|
Cohort studies have an intuitive logic to them, but they can be very problematic when:
In the first case, the rarity of the disease requires enrollment of very large numbers of people. In the second case, the long period of follow-up requires efforts to keep contact with and collect outcome information from individuals. In all three situations, cost and feasibility become an important concern.
A case-control design offers an alternative that is much more efficient. The goal of a case-control study is the same as that of cohort studies, i.e. to estimate the magnitude of association between an exposure and an outcome. However, case-control studies employ a different sampling strategy that gives them greater efficiency. As with a cohort study, a case-control study attempts to identify all people who have developed the disease of interest in the defined population. This is not because they are inherently more important to estimating an association, but because they are almost always rarer than non-diseased individuals, and one of the requirements of accurate estimation of the association is that there are reasonable numbers of people in both the numerators (cases) and denominators (people or person-time) in the measures of disease frequency for both exposed and reference groups. However, because most of the denominator is made up of people who do not develop disease, the case-control design avoids the need to collect information on the entire population by selecting a sample of the underlying population.
Rothman describes the case-control strategy as follows:
|
"Case-control studies are best understood by considering as the starting point a source population, which represents a hypothetical study population in which a cohort study might have been conducted. The source population is the population that gives rise to the cases included in the study. If a cohort study were undertaken, we would define the exposed and unexposed cohorts (or several cohorts) and from these populations obtain denominators for the incidence rates or risks that would be calculated for each cohort. We would then identify the number of cases occurring in each cohort and calculate the risk or incidence rate for each. In a case-control study the same cases are identified and classified as to whether they belong to the exposed or unexposed cohort. Instead of obtaining the denominators for the rates or risks, however, a control group is sampled from the entire source population that gives rise to the cases. Individuals in the control group are then classified into exposed and unexposed categories. The purpose of the control group is to determine the relative size of the exposed and unexposed components of the source population." |
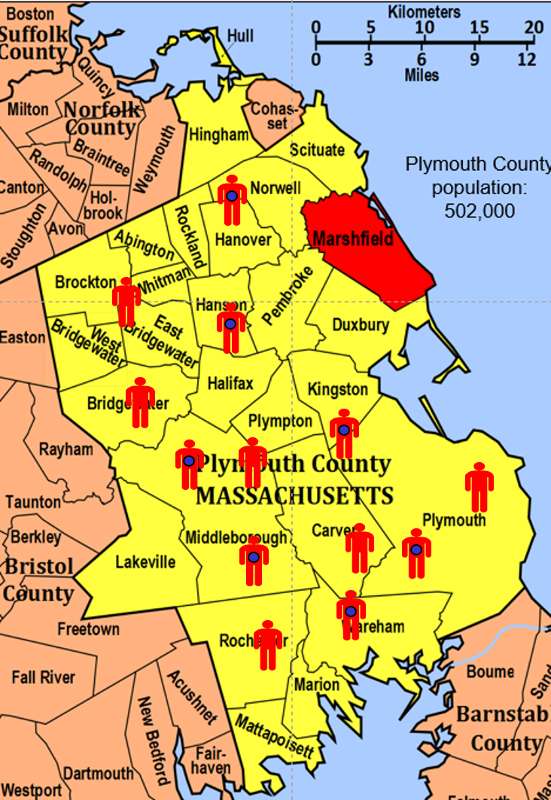
To illustrate this consider the following hypothetical scenario in which the source population is Plymouth County in Massachusetts, which has a total population of 6,647 (hypothetical). Thirteen people in the county have been diagnosed with an unusual disease and seven of them have a particular exposure that is suspected of being an important contributing factor. The chief problem here is that the disease is quite rare.
If I somehow had exposure and outcome information on all of the subjects in the source population and looked at the association using a cohort design, it might look like this:
|
|
Diseased |
Non-diseased |
Total |
|---|---|---|---|
|
Exposed |
7 |
1,000 |
1,007 |
|
Non-exposed |
6 |
5,634 |
5,640 |
Therefore, the incidence in the exposed individuals would be 7/1,007 = 0.70%, and the incidence in the non-exposed individuals would be 6/5,640 = 0.11%. Consequently, the risk ratio would be 0.70/0.11=6.52, suggesting that those who had the risk factor (exposure) had 6.5 times the risk of getting the disease compared to those without the risk factor. This is a strong association.
In this hypothetical example, I had data on all 6,647 people in the source population, and I could compute the probability of disease (i.e., the risk or incidence) in both the exposed group and the non-exposed group, because I had the denominators for both the exposed and non-exposed groups.
The problem, of course, is that I usually don't have the resources to get the data on all subjects in the population. If I took a random sample of even 5-10% of the population, I might not have any diseased people in my sample.
An alternative approach would be to use surveillance databases or administrative databases to find most or all 13 of the cases in the source population and determine their exposure status. However, instead of enrolling all of the other 5,634 residents, suppose I were to just take a sample of the non-diseased population. In fact, suppose I only took a sample of 1% of the non-diseased people and I then determined their exposure status. The data might look something like this:
|
|
Diseased |
Non-diseased |
Total |
|---|---|---|---|
|
Exposed |
7 |
10 |
unknown |
|
Non-exposed |
6 |
56 |
unknown |
With this sampling approach I can no longer compute the probability of disease in each exposure group, because I no longer have the denominators in the last column. In other words, I don't know the exposure distribution for the entire source population. However, the small control sample of non-diseased subjects gives me a way to estimate the exposure distribution in the source population. So, I can't compute the probability of disease in each exposure group, but I can compute the odds of disease in the case-control sample.
The odds of disease among the exposed sample are 7/10, and the odds of disease in the non-exposed sample are 6/56. If I compute the odds ratio, I get (7/10) / (5/56) = 6.56, very close to the risk ratio that I computed from data for the entire population. We will consider odds ratios and case-control studies in much greater depth in a later module. However, for the time being the key things to remember are that:
 Probabilities always range between 0 and 1.
If the probability of an event occurring is Y, then the probability of the event not occurring is 1-Y. (Example: If the probability of an event is 0.80 (80%), then the probability that the event will not occur is 1-0.80 = 0.20, or 20%.
The odds of an event represent the ratio of the (probability that the event will occur) / (probability that the event will not occur). This could be expressed as follows:
Odds of event = Y / (1-Y)
So, in this example, if the probability of the event occurring = 0.80, then the odds are 0.80 / (1-0.80) = 0.80/0.20 = 4 (i.e., 4 to 1).
NOTE that when the probability is low, the odds and the probability are very similar.
On Sept. 8, 2011 the New York Times ran an article on the economy in which the writer began by saying "If history is a guide, the odds that the American economy is falling into a double-dip recession have risen sharply in recent weeks and may even have reached 50 percent." Further down in the article the author quoted the economist who had been interviewed for the story. What the economist had actually said was, "Whether we reach the technical definition [of a double-dip recession] I think is probably close to 50-50."
Question: Was the author correct in saying that the "odds" of a double-dip recession may have reached 50 percent?
ANSWER
|
Key Concept: In a study that is designed and conducted as a case-control study, you cannot calculate incidence. Therefore, you cannot calculate risk ratio or risk difference. You can only calculate an odds ratio. However, in certain situations a case-control study is the only feasible study design. |
Decisions regarding which study design to use rest on a number of factors including::
There are some situations in which more than one study design could be used.
Smoking and Lung Cancer: For example, when investigators first sought to establish whether there was a link between smoking and lung cancer, they did a study by finding hospital subjects who had lung cancer and a comparison group of hospital patients who had diseases other than cancer. They then compared the prior exposure histories with respect to smoking and many other factors. They found that past smoking was much more common in the lung cancer cases, and they concluded that there was an association. The advantages to this approach were that they were able to collect the data they wanted relatively quickly and inexpensively, because they started with people who already had the disease of interest.
The short video below provides a nice overview of epidemiological studies.

However, there were several limitations to the study they had done. The study design did not allow them to measure the incidence of lung cancer in smokers and non-smokers, so they couldn't measure the absolute risk of smoking. They also didn't know what other diseases smoking might be associated with, and, finally, they were concerned about some of the biases that can creep into this type of study.
As a result, these investigators then initiated another study. They invited all of the male physicians in the United Kingdom to fill out questionnaires regarding their health status and their smoking status. They then focused on the healthy physicians who were willing to participate, and the investigators mailed follow-up questionnaires to them every few years. They also had a way of finding out the cause of death for any subjects who became ill and died. The study continued for about 50 years. Along the way the investigators periodically compared the incidence of death among non-smoking physicians and physicians who smoked small, moderate or heavy amounts of tobacco.
These studies were useful, because they were able to demonstrate that smokers had an increased risk of over 20 different causes of death. They were also able to measure the incidence of death in different categories, so they knew the absolute risk for each cause of death. Of course, the downside to this approach was that it took a long time, and it was very costly. So, both a case-control study and a prospective cohort study provided useful information about the association between smoking and lung cancer and other diseases, but there were distinct advantages and limitations to each approach.
Hepatitis Outbreak in Marshfield, MA
In 2004 there was an outbreak of hepatitis A on the South Shore of Massachusetts. Over a period of a few weeks there were 20 cases of hepatitis A that were reported to the MDPH, and most of the infected persons were residents of Marshfield, MA. Marshfield's health department requested help in identifying the source from MDPH. The investigators quickly performed descriptive epidemiology. The epidemic curve indicated a point source epidemic, and most of the cases lived in the Marshfield area, although some lived as far away as Boston. They conducted hypothesis-generating interviews, and taken together, the descriptive epidemiology suggested that the source was one of five or six food establishments in the Marshfield area, but it wasn't clear which one. Consequently, the investigators wanted to conduct an analytic study to determine which restaurant was the source. Which study design should have been conducted? Think about the scenario, and then open the "Quiz Me" below and choose your answer.
Link to more on the hepatitis outbreak
Case-control studies are particularly efficient for rare diseases because they begin by identifying a sufficient number of diseased people (or people have some "outcome" of interest) to enable you to do an analysis that tests associations. Case-control studies can be done in just about any circumstance, but they are particularly useful when you are dealing with rare diseases or disease for which there is a very long latent period, i.e. a long time between the causative exposure and the eventual development of disease.
