

Confidence Intervals for Measures of Effect (Optional)
the magnitude of the differences between the two groups using effect measures and confidence intervals for those measures. We can calculate these effect measures and their confidence intervals when the data come from a 2x2 table in the following manner.
Risk Difference (RD)
![]()
We can calculate the confidence interval for this quantity as:

Relative Risk (RR)

The confidence interval can be calculated by taking the log of the relative risk and assuming that is normally distributed. So the confidence interval for the log of the relative risk is given by:

Therefore the estimated confidence interval of the relative risk is:

Odds Ratio (OR)

The confidence interval for this quantity is again estimated using a log transformation on the OR and assuming normality of that quantity. Therefore the confidence interval for the log of the odds ratio is:

where a, b, c, d are the numbers of observations in each of the four cells of a 2x2 table. The confidence interval for the odds ratio can then be calculated as:
Let's go back to the data comparing the frequency of coronary artery abnormalities between subjects treated with gamma globulin (GG) versus aspirin (ASA) and compute the confidence intervals for these three measures of effect (measures of association).
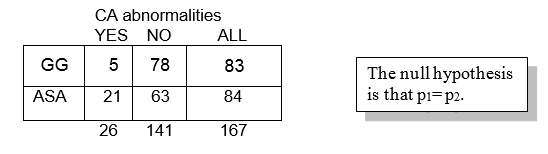
Risk Difference: RD = -0.19
The 95% confidence interval for the RD is estimated as:

Relative Risk: RR = 0.24
The 95% confidence interval for the log of the relative risk is estimated:

So that the confidence interval of the relative risk is:
![]()
Odds Ratio: OR = 0.19
The 95% confidence interval for the log of the odds ratio is:

.Therefore, the confidence interval for the odds ratio is obtained by exponentiation these values:
All of these estimates and their corresponding confidence intervals indicate that those with ASA have a statistically significant higher risk (or odds) of CA abnormalities than those with GG.