

When to Use a Nonparametric Test
Nonparametric tests are sometimes called distribution-free tests because they are based on fewer assumptions (e.g., they do not assume that the outcome is approximately normally distributed). Parametric tests involve specific probability distributions (e.g., the normal distribution) and the tests involve estimation of the key parameters of that distribution (e.g., the mean or difference in means) from the sample data. The cost of fewer assumptions is that nonparametric tests are generally less powerful than their parametric counterparts (i.e., when the alternative is true, they may be less likely to reject H0).
It can sometimes be difficult to assess whether a continuous outcome follows a normal distribution and, thus, whether a parametric or nonparametric test is appropriate. There are several statistical tests that can be used to assess whether data are likely from a normal distribution. The most popular are the Kolmogorov-Smirnov test, the Anderson-Darling test, and the Shapiro-Wilk test1. Each test is essentially a goodness of fit test and compares observed data to quantiles of the normal (or other specified) distribution. The null hypothesis for each test is H0: Data follow a normal distribution versus H1: Data do not follow a normal distribution. If the test is statistically significant (e.g., p<0.05), then data do not follow a normal distribution, and a nonparametric test is warranted. It should be noted that these tests for normality can be subject to low power. Specifically, the tests may fail to reject H0: Data follow a normal distribution when in fact the data do not follow a normal distribution. Low power is a major issue when the sample size is small - which unfortunately is often when we wish to employ these tests. The most practical approach to assessing normality involves investigating the distributional form of the outcome in the sample using a histogram and to augment that with data from other studies, if available, that may indicate the likely distribution of the outcome in the population.
There are some situations when it is clear that the outcome does not follow a normal distribution. These include situations:
- when the outcome is an ordinal variable or a rank,
- when there are definite outliers or
- when the outcome has clear limits of detection.
Using an Ordinal Scale
Consider a clinical trial where study participants are asked to rate their symptom severity following 6 weeks on the assigned treatment. Symptom severity might be measured on a 5 point ordinal scale with response options: Symptoms got much worse, slightly worse, no change, slightly improved, or much improved. Suppose there are a total of n=20 participants in the trial, randomized to an experimental treatment or placebo, and the outcome data are distributed as shown in the figure below.
Distribution of Symptom Severity in Total Sample
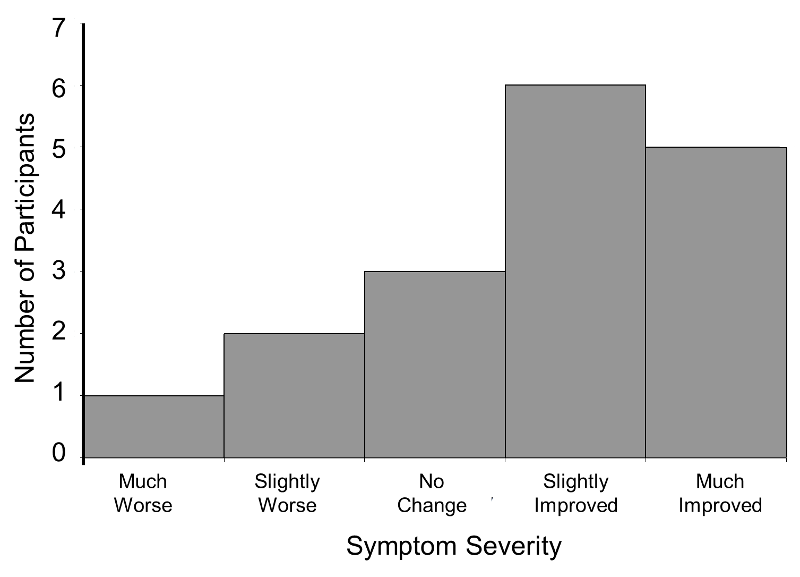
The distribution of the outcome (symptom severity) does not appear to be normal as more participants report improvement in symptoms as opposed to worsening of symptoms.
When the Outcome is a Rank
In some studies, the outcome is a rank. For example, in obstetrical studies an APGAR score is often used to assess the health of a newborn. The score, which ranges from 1-10, is the sum of five component scores based on the infant's condition at birth. APGAR scores generally do not follow a normal distribution, since most newborns have scores of 7 or higher (normal range).
When There Are Outliers
In some studies, the outcome is continuous but subject to outliers or extreme values. For example, days in the hospital following a particular surgical procedure is an outcome that is often subject to outliers. Suppose in an observational study investigators wish to assess whether there is a difference in the days patients spend in the hospital following liver transplant in for-profit versus nonprofit hospitals. Suppose we measure days in the hospital following transplant in n=100 participants, 50 from for-profit and 50 from non-profit hospitals. The number of days in the hospital are summarized by the box-whisker plot below.
Distribution of Days in the Hospital Following Transplant
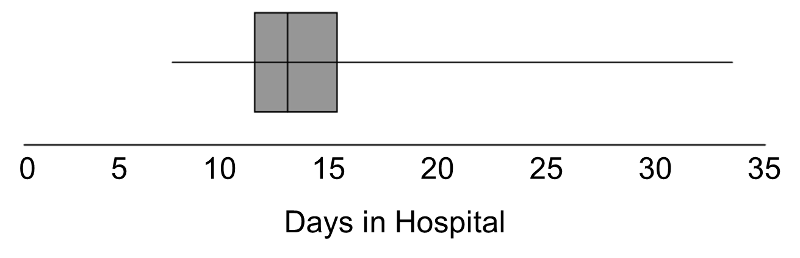
Note that 75% of the participants stay at most 16 days in the hospital following transplant, while at least 1 stays 35 days which would be considered an outlier. Recall from page 8 in the module on Summarizing Data that we used Q1-1.5(Q3-Q1) as a lower limit and Q3+1.5(Q3-Q1) as an upper limit to detect outliers. In the box-whisker plot above, 10.2, Q1=12 and Q3=16, thus outliers are values below 12-1.5(16-12) = 6 or above 16+1.5(16-12) = 22.
Limits of Detection
In some studies, the outcome is a continuous variable that is measured with some imprecision (e.g., with clear limits of detection). For example, some instruments or assays cannot measure presence of specific quantities above or below certain limits. HIV viral load is a measure of the amount of virus in the body and is measured as the amount of virus per a certain volume of blood. It can range from "not detected" or "below the limit of detection" to hundreds of millions of copies. Thus, in a sample some participants may have measures like 1,254,000 or 874,050 copies and others are measured as "not detected." If a substantial number of participants have undetectable levels, the distribution of viral load is not normally distributed.
|
Hypothesis Testing with Nonparametric Tests In nonparametric tests, the hypotheses are not about population parameters (e.g., μ=50 or μ1=μ2). Instead, the null hypothesis is more general. For example, when comparing two independent groups in terms of a continuous outcome, the null hypothesis in a parametric test is H0: μ1 =μ2. In a nonparametric test the null hypothesis is that the two populations are equal, often this is interpreted as the two populations are equal in terms of their central tendency.
|

Advantages of Nonparametric Tests
Nonparametric tests have some distinct advantages. With outcomes such as those described above, nonparametric tests may be the only way to analyze these data. Outcomes that are ordinal, ranked, subject to outliers or measured imprecisely are difficult to analyze with parametric methods without making major assumptions about their distributions as well as decisions about coding some values (e.g., "not detected"). As described here, nonparametric tests can also be relatively simple to conduct.