


Confidence Intervals for One Sample: Continuous Outcome
Suppose we wish to estimate the mean systolic blood pressure, body mass index, total cholesterol level or white blood cell count in a single target population. We select a sample and compute descriptive statistics including the sample size (n), the sample mean, and the sample standard deviation (s). The formulas for confidence intervals for the population mean depend on the sample size and are given below.
Confidence Intervals for μ
- For n > 30


Use the Z table for the standard normal distribution.
- For n<30

Use the t table with df=n-1
Example: Descriptive statistics on variables measured in a sample of a n=3,539 participants attending the 7th examination of the offspring in the Framingham Heart Study are shown below.
|
Characteristic |
n |
Sample Mean |
Standard Deviation (s) |
|
Systolic Blood Pressure |
3,534 |
127.3 |
19.0 |
|
Diastolic Blood Pressure |
3,532 |
74.0 |
9.9 |
|
Total Serum Cholesterol |
3,310 |
200.3 |
36.8 |
|
Weight |
3,506 |
174.4 |
38.7 |
|
Height |
3,326 |
65.957 |
3.749 |
|
Body Mass Index |
3,326 |
28.15 |
5.32 |
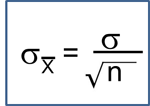
Because the sample is large, we can generate a 95% confidence interval for systolic blood pressure using the following formula:
The Z value for 95% confidence is Z=1.96. [Note: Both the table of Z-scores and the table of t-scores can also be accessed from the "Other Resources" on the right side of the page.]
Substituting the sample statistics and the Z value for 95% confidence, we have
So the confidence interval is
(126.7,127.9)
A point estimate for the true mean systolic blood pressure in the population is 127.3, and we are 95% confident that the true mean is between 126.7 and 127.9. The margin of error is very small here because of the large sample size

What is the 90% confidence interval for BMI? (Note that Z=1.645 to reflect the 90% confidence level.)
The table below shows data on a subsample of n=10 participants in the 7th examination of the Framingham Offspring Study.
|
Characteristic |
n |
Sample Mean |
Standard Deviation (s) |
|
Systolic Blood Pressure |
10 |
121.2 |
11.1 |
|
Diastolic Blood Pressure |
10 |
71.3 |
7.2 |
|
Total Serum Cholesterol |
10 |
202.3 |
37.7 |
|
Weight |
10 |
176.0 |
33.0 |
|
Height |
10 |
67.175 |
4.205 |
|
Body Mass Index |
10 |
27.26 |
3.10 |
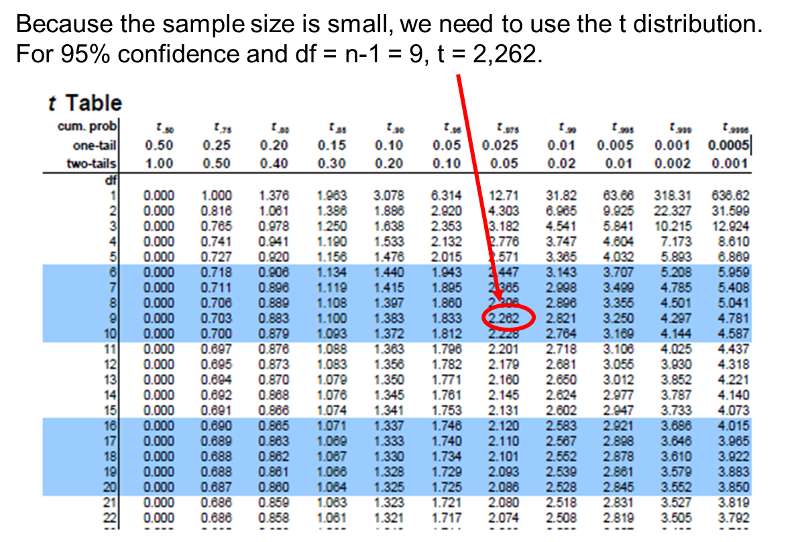
Suppose we compute a 95% confidence interval for the true systolic blood pressure using data in the subsample. Because the sample size is small, we must now use the confidence interval formula that involves t rather than Z.
The sample size is n=10, the degrees of freedom (df) = n-1 = 9. The t value for 95% confidence with df = 9 is t = 2.262.
Substituting the sample statistics and the t value for 95% confidence, we have the following expression:
 .
.
Interpretation: Based on this sample of size n=10, our best estimate of the true mean systolic blood pressure in the population is 121.2. Based on this sample, we are 95% confident that the true systolic blood pressure in the population is between 113.3 and 129.1. Note that the margin of error is larger here primarily due to the small sample size.
Using the subsample in the table above, what is the 90% confidence interval for BMI?